📘 Screen: Scouting
Scouting is the record of pest monitoring done in the field: the scout walks the field, stops at a few points along the way and records what was found at each stop. There is no fixed grid or position set by the system — where to stop and how many times is up to the scout and the farm's routine. In upCampo this work is done on the phone, point by point, and this screen is where the agronomist reviews, corrects and — occasionally — adds what came in from the app.
From these points the system builds the field's result: the average occurrence of each pest and the comparison with the registered action threshold, which tells you whether it is time to spray. Since the total number of points walked is the divisor of the averages, stopping more often gives a truer picture of the area. And a point entered wrong doesn't spoil only that point — it goes into the average for the whole field on that day.
📍 Location in the system
Menu: Crops > Scouting
🧩 Main function
Scouting is done in the field, with the app — that is where the scout opens the point, counts the pest and takes the photo. This web portal screen exists for what the app doesn't handle: reviewing what came in, correcting a wrong entry and making an occasional addition, when someone scouted without the phone or forgot to enter it.
It is ideal for:
- Reviewing the data received
- Correcting small pieces of information
- Occasionally adding a point that was not entered in the app
- Deleting wrong records
Each record contains:
- Date and time of the scouting
- Crop, field, variety
- DAE, plant height and nodes
- Collection points and quantities of pests found
- Photos taken at the time of collection
🔎 The list
The list opens filtered by Season and Date — the date is required, and it defines the scouting day you are reviewing. The columns are Field, Variety, Crop, Date, Stage, User, Point, Opening, Pests, Size, Preset Value and Value, each with its own search box.
📝 Record fields
| Field | Description |
|---|---|
| Date and time | When the point was scouted. |
| Point | Number of the point within the field. |
| Season Planting | The planting scouted — it is what ties together field, crop and season. |
| Variety | The cultivar at the point, when the planting is split by variety. |
| Stage | The growth stage at the time of collection, among those registered for the crop. |
| Latitude and Longitude | Where the point was taken. They come filled in when the record came from the app. |
| User | Who did the scouting. |
🔀 "Point Opening": two different records on the same screen
The Point Opening checkbox swaps the whole form. It is what separates the record of the plant from the record of the pest:
Unchecked — pest count
This is the entry for a pest found at the point:
- Type: Plant, Beat Sheet, Meter or Assessment — the method used for the count
- Plant Qty: how many plants were assessed
- Pests: the pest, weed or disease found
- Size: the stage/size of the individual, when the pest is counted that way (small, medium, large caterpillar)
- Value: the count
When the selected pest or size has preset values registered, a list of ready-made options to select appears instead — this speeds up counting in the field and feeds the Preset Value column in the list.
Checked — plant data
This is the point opening record, with the growth measurements. Everything related to pests disappears and a grid of checkbox + value pairs appears: you check what was measured and enter the number next to it. The fields cover:
- Growth: height, number of nodes, internode distance, height of the first to the fifth node and depth
- Population: stand, plants per meter and number of stems
- Soybean: number of pods, height of the first pod and seeds per pod
- Cotton: squares, bolls (small, medium, large and total), bolls by position — from 1 to 5 —, rotten boll, open bolls and boll weevil
These are the measurements that feed the comparison with the ideal vegetative growth of the variety and the crop.
🧮 How upCampo turns points into a result
What the scout enters is the count at each point. The number the agronomist looks at — and that is compared with the action threshold — comes from a calculation over all the points in that field on that day. The form of that calculation comes from the Calculation method field in the pest record:
An example: 10 points walked, pest found in 4 of them, 20 individuals counted in total.
| Calculation method | Math | Result |
|---|---|---|
| Simple sum | — | 20 |
| Average per point | 20 ÷ 10 | 2.0 per point |
| Average per occurrence | 20 ÷ 4 | 5.0 per point with pest |
The difference between the two averages is what usually causes confusion: Average per point spreads the pest across the whole field and answers "what is the average pressure on the area"; Average per occurrence looks only where it appeared and answers "where there is some, how much is there". A concentrated hot spot gives a low average per point and a high average per occurrence — and that contrast is exactly what indicates a localized infestation rather than a widespread one.
In the IPM Standard, the result depends on the type of scouting: for beat sheet and m², it is the average per point; per linear meter, the value is expressed per meter; for counting per plant, it becomes a percentage.
📊 Dashboards and overall view
On the platform's home screen there is a dedicated dashboard called Scouting, where the data is analyzed in a consolidated way.
There the agronomist can:
- See scouting grouped by date and field
- Analyze each collection point in detail
- See the map with the georeferenced points
- Check the photos taken in the field
- Check the crop stage at the time of collection
- Access the pest history by field, with comparative data
📱 Scouting in the app
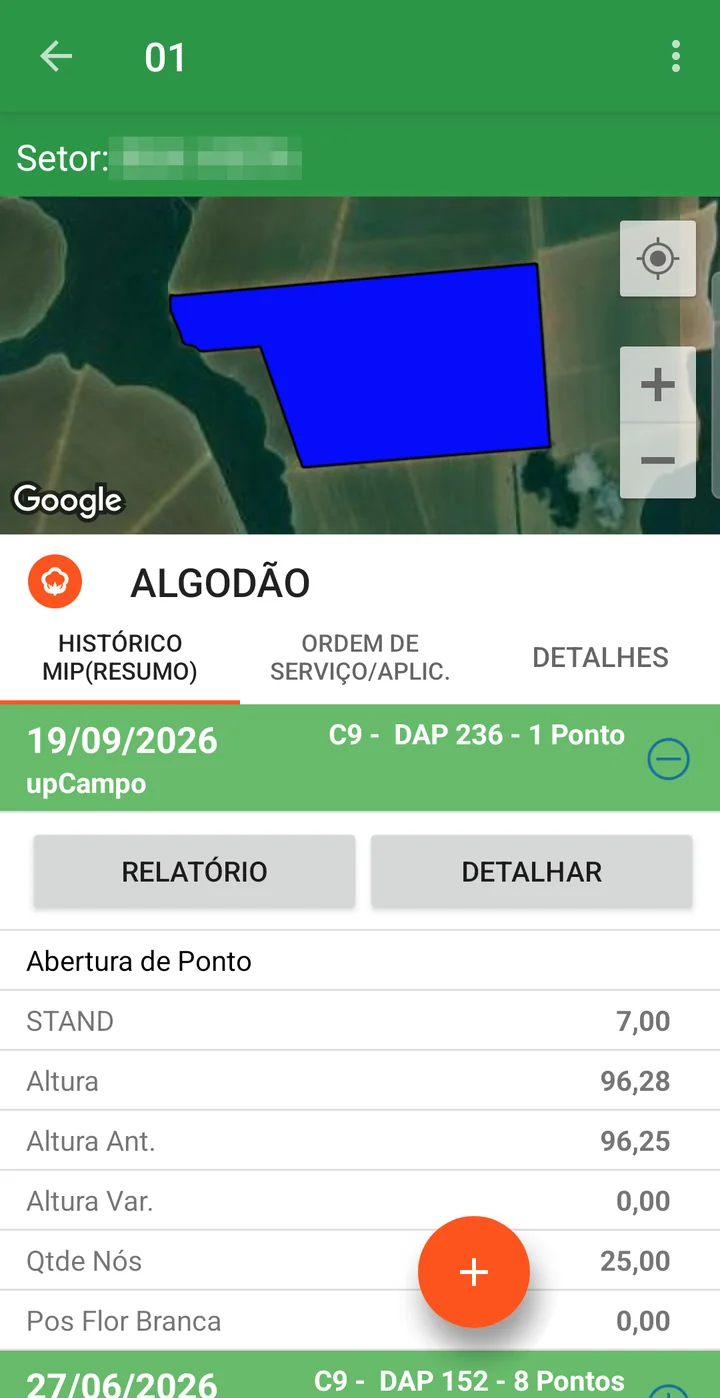
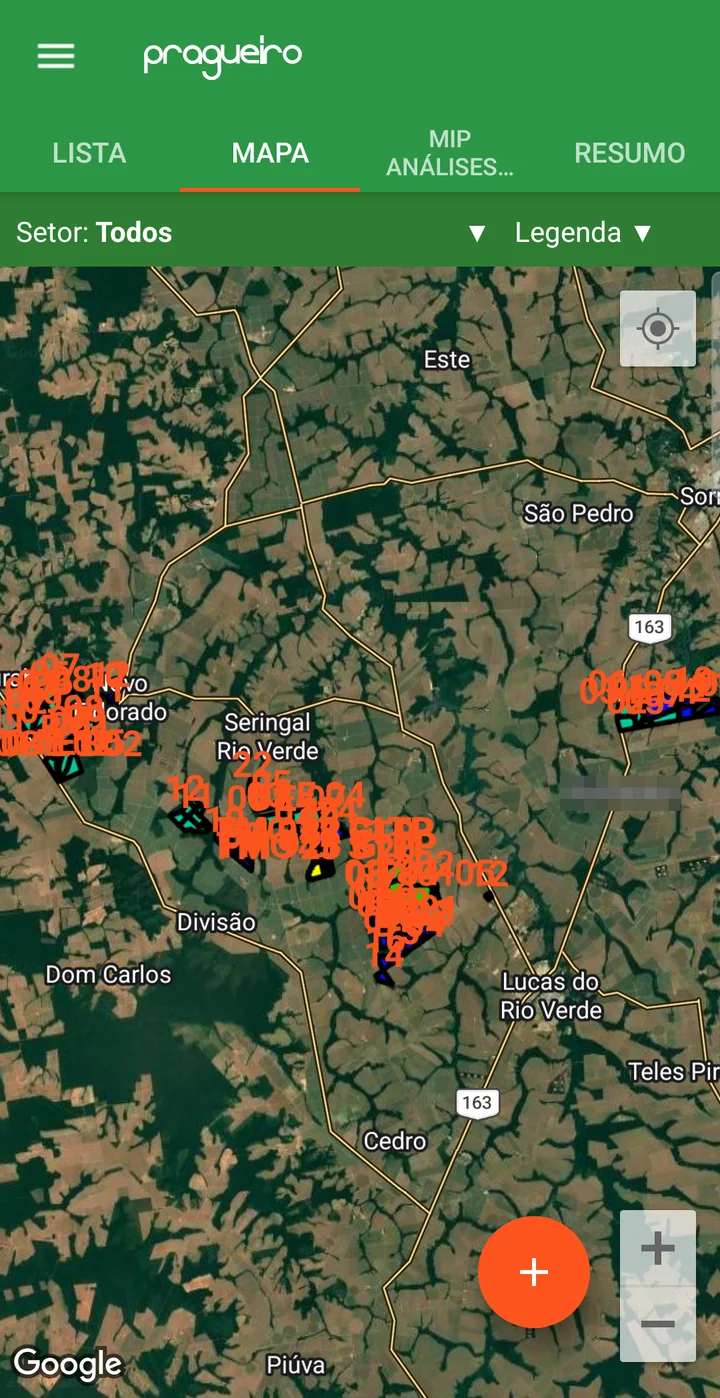
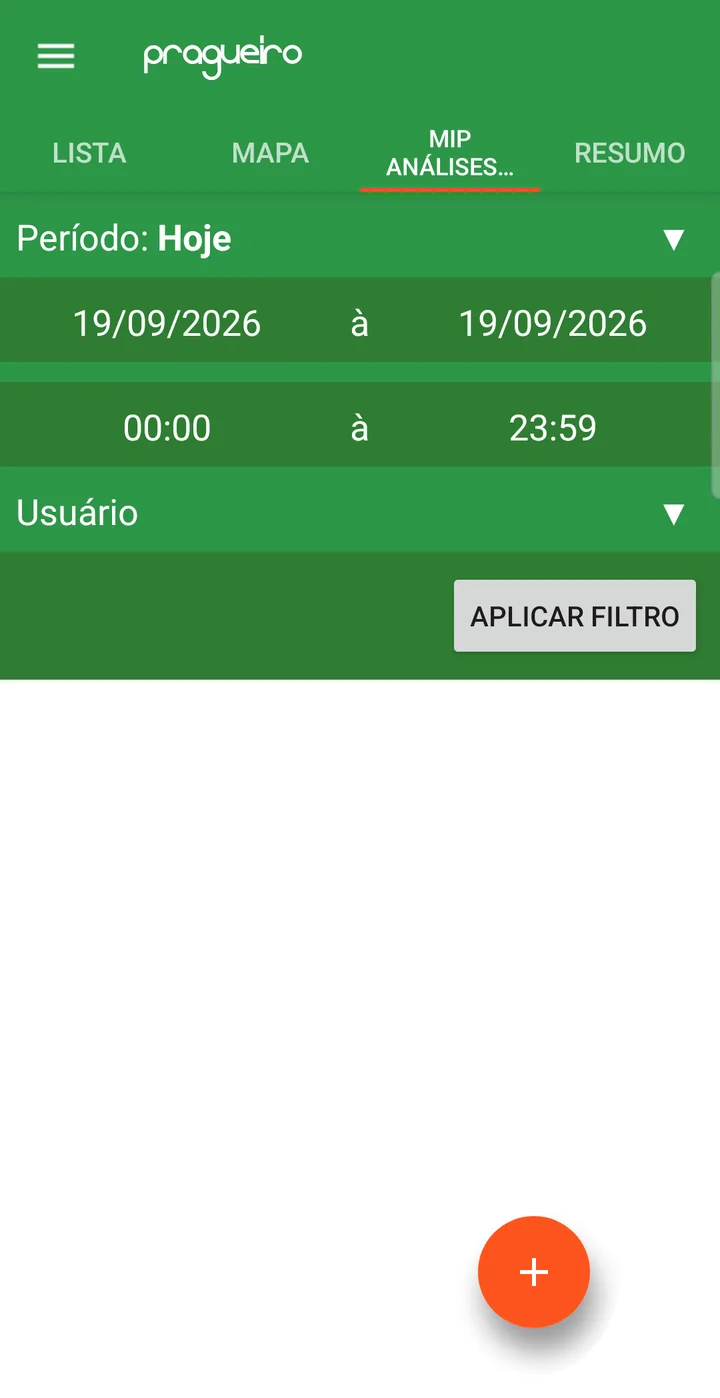
What this screen shows in the web portal starts in the app, in the Scouting (IPM) menu. That is where the scout opens the points and counts the pests — the step by step, with screenshots, is in the Quick Guide - Pest Monitoring. Besides collecting, the scout can look up on the phone itself what has already been done:
- Field history — tapping the field, the app shows the map of the area and, on the IPM HISTORY (SUMMARY) tab, each scouting with the date, who did it, the stage, days after planting, number of points and the values recorded, with the REPORT and DETAIL buttons. Next to it are the WORK ORDER/APPL. and DETAILS tabs.
- MAP — the farm's fields on the map, with a sector filter and legend.
- IPM MGMT ANALYSES — the management view of scouting, by period and user.
📊 Related reports
Crops serve as the basis for several reports on the platform. Some of them are:
Shows the scouting in detail, point by point, pest by pest, as well as the location of the points taken, plus photos and observation. ⚠️ Important: be careful with the period — since the report has photos, maps and lots of detail, generating it for long periods can be slower.
A bit more condensed, without the map, ideal for large volumes of data.
Shows overall statistics for the scouts, ideal for team management.
- The system gives a clear view of the crop's pest and disease situation
- Management decisions become more accurate
- The pest history by field lets you spot patterns and act preventively
Scouting on the phone is up.Monitora, upCampo's pest monitoring module.
❓ Frequently asked questions
How do I enter pest scouting through the web portal?
You can, but it is not the normal path: scouting is done in the field, with the app. Use the New button on this screen for an occasional addition — a point someone scouted without the phone, for example — or to correct and delete what already came from the app.
What is the "Point Opening" checkbox for?
It swaps the form. Unchecked, you record a pest found: count type, pest, size and value. Checked, you record the plant measurements — height, nodes, stand, pods, bolls, open bolls and so on. They are two different records at the same point.
What is the difference between Plant, Beat Sheet, Meter and Assessment?
It is the counting method used at that point. Which ones are available for your crop is defined in the Crop record, in the pest monitoring section — where you also choose which one is selected by default.
What is the "Preset Value" shown in the list?
These are ready-made count options, registered for that pest or size. When they exist, the operator selects the option instead of typing the number — which speeds up collection in the field and standardizes the record.
What information comes from the field with each scouting?
Date and time, crop, field and variety, DAE, plant height and nodes, the collection points with the quantities of pests found, and the photos taken at the time of collection.
Where can I see scouting in a consolidated view?
On the Scouting dashboard, on the platform's home screen. There the agronomist sees the data grouped by date and field, the map with the georeferenced points, the photos, the crop stage and the pest history by field.
I recorded a scouting wrong in the field. Can I fix it?
Yes. This screen lets you adjust small pieces of information and also delete the record when it is wrong.