📘 Screen: Trap x Season
The Trap x Season screen is used to register and georeference the traps installed on the farm during a specific season.
Each trap registered here is linked to a group and ready to be used for collections through the app, the web portal or integrations with electronic traps.
Once registered, it is ready to generate collections.
🔍 What it is
An agricultural trap is a device used in crops to catch insects and identify the pests present in the field. Traps work as a form of monitoring, helping the grower know when and where a given pest is showing up.
Traps often use a pheromone, a substance that attracts the target insect and makes the catch more effective.
Traps are usually spread around the fields. Ideally, the traps should cover at least each side of a field, ensuring efficient monitoring that represents the area.
📍 Location in the system
Menu: Crops > Trap x Season
🧩 Main function
Lets you register physical or electronic traps linked to a season, grouping them by type and location.
These traps can be used for:
- Manual collections through the app
- Manual entries through the web portal
- Integrations with sensors or digital traps
📝 Registration fields
| Field | Description |
|---|---|
| Season | The season the trap is linked to. |
| Trap Group | Type/classification of the trap (e.g., Boll Weevil, Caterpillar, Leafhopper). The group defines which pests will be counted and from what count a catch becomes an alert. |
| Number | Required. Trap identification (code or sequential number). |
| Field | The field the trap belongs to. |
| QR Code | Code on the label stuck to the trap, so the operator can identify it by scanning it in the field. |
| Latitude and Longitude | Geographic position of the trap — this is what lets the app guide the operator to it and what places it on the map. |
| Active | Defines whether the trap is still in use in the season. |
The Sector appears as a column in the list, but it is not typed here: it comes from the selected field. The list shows Number, Sector, Trap Group, Field and Active, with a Season filter right above it.
📥 Tab: Collections
After the trap is registered, the user can record the collections made throughout the season.
Collections can be made in four ways:
- App: manual collection by the scout in the field, directly on the phone, with or without internet.
- Web portal: through the Collections tab on this screen, ideal for corrections or additional entries.
- Electronic trap integration: if the customer has sensors installed, the catch data is synchronized automatically with the system.
- Import Collections from Excel: a button on the list, for those who keep the records in a spreadsheet (see below).
Each collection records:
| Field | Description |
|---|---|
| Date | Required. Day the trap was checked. |
| User | Who made the collection. |
| Found? | Yes or No. Recording a "No" is as important as a "Yes": it is what separates a trap that was checked and empty from a trap nobody went to check. |
| Quantity | How many individuals were caught. |
Import Collections from Excel
A button on the list that brings in the collections from a spreadsheet all at once. The file must be .xls
or .xlsx and must have two required columns:
- data — the collection date
- quantidade — in numeric format
The window itself has an instructions section that repeats this format.
📱 Collecting in the app
The phone is where collecting really happens: the scout walks the traps with the app open, records what was found in each one and syncs when there is signal. In the Trap menu the screen opens in two tabs, LIST and MAP.
The list shows one trap per row, with the number, the sector and how long ago the last collection was — Today, N days ago or Never, for one that has not been checked yet. When the group has pests registered, the row also shows how many were found and which ones. The colored bar on the side of each row is the group's level range, and it is the same color as the pin on the map. At the top are the Trap Group, Sector, Field and Order filters.
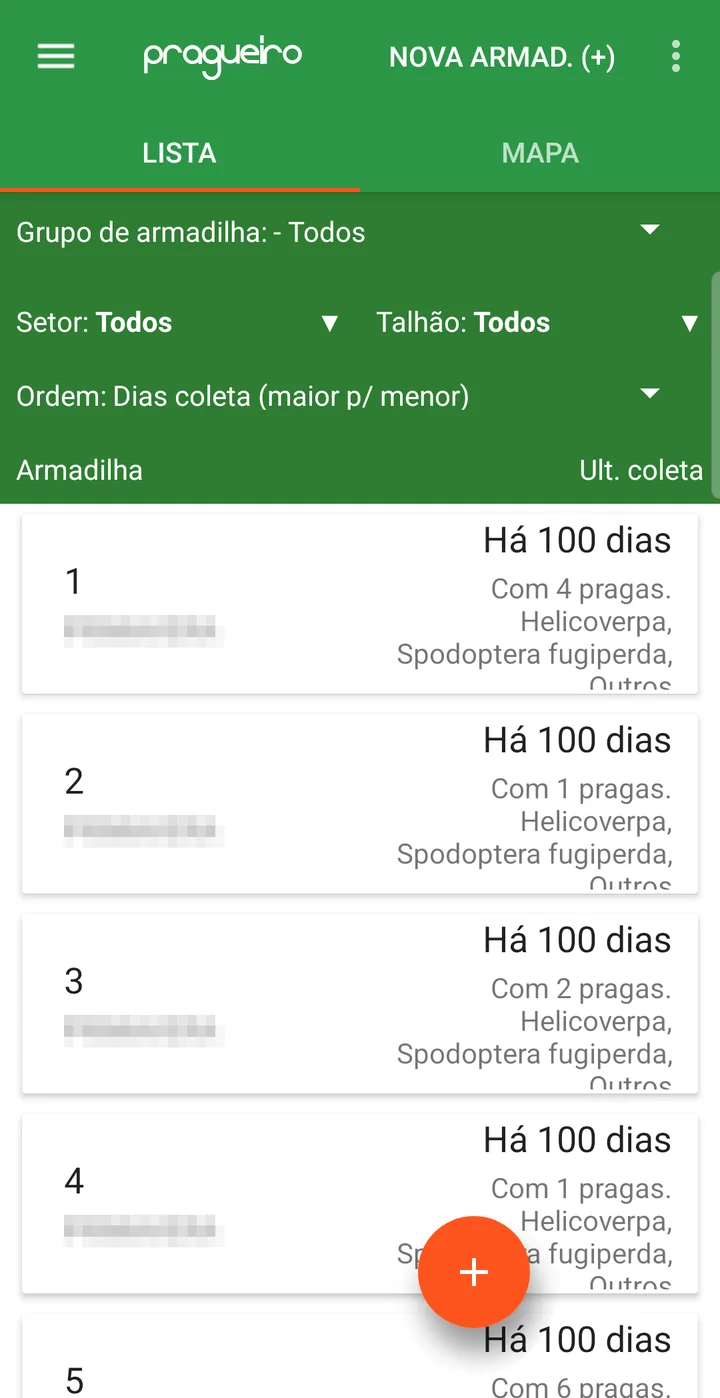
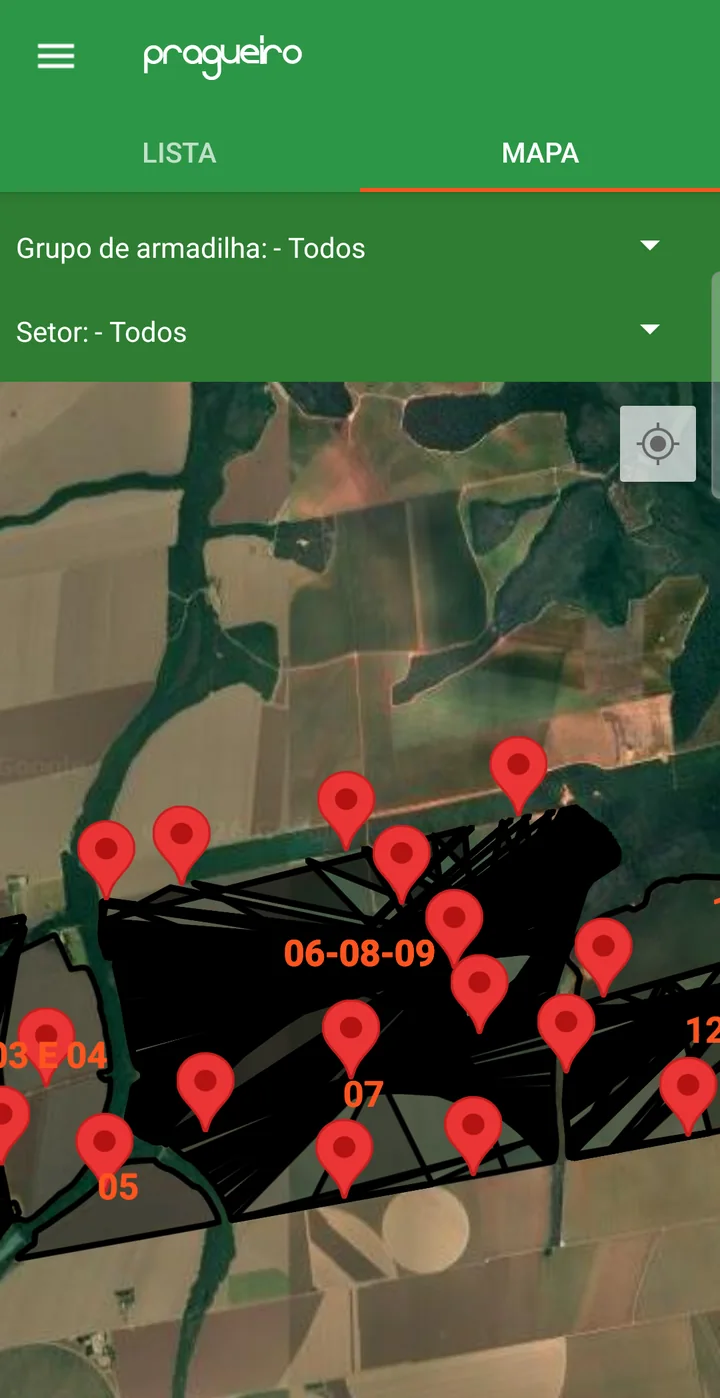
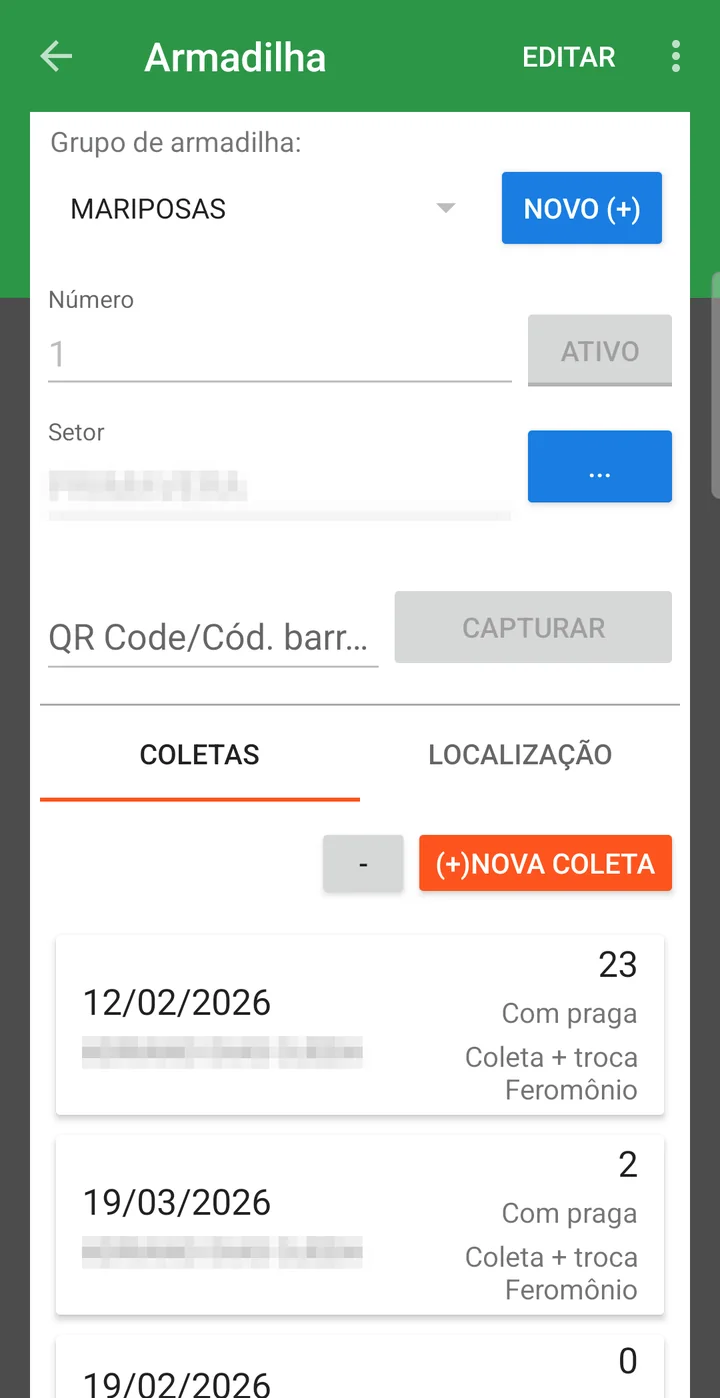
Tapping a trap opens its record with two tabs: COLLECTIONS, with the history, and LOCATION, with the map. Each collection in the list shows the date, who made it, the quantity, whether there were pests and the classification. The (+)NEW COLLECTION button opens a new entry.
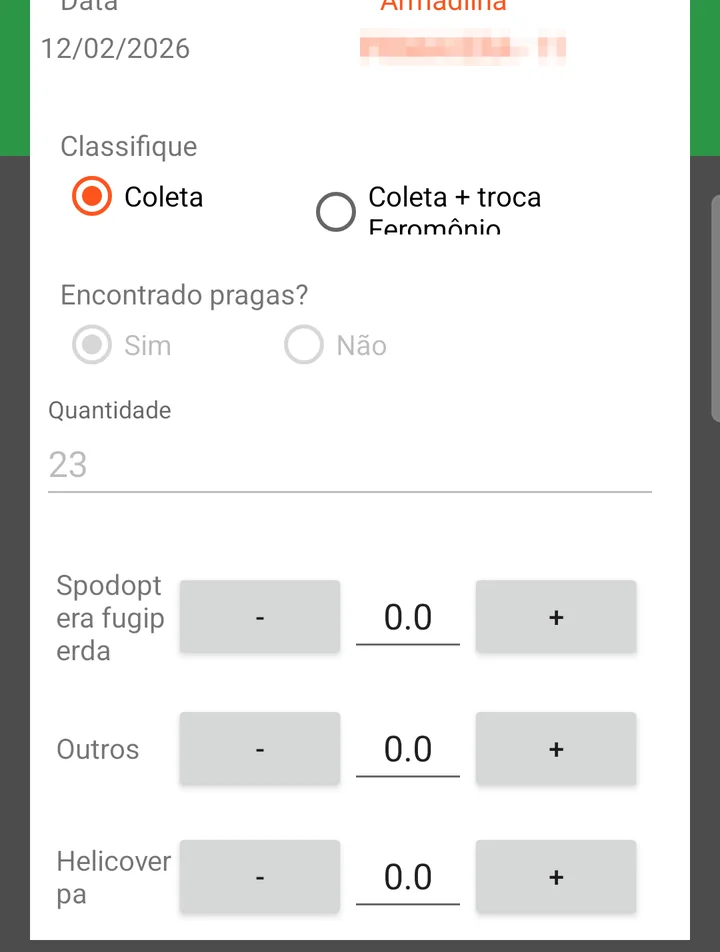
The collection screen has two fields that exist only in the app:
| Field | Description |
|---|---|
| Classify | Collection or Collection + pheromone change. Marks the visit when the pheromone lure was replaced — this is what tells you whether the trap was attractive during that period. |
| Count per pest | When the trap group has pests registered, a row with − and + appears for each one. In that case the Quantity is locked: it is the sum of the pests counted. With no pests in the group, the quantity is typed in. |
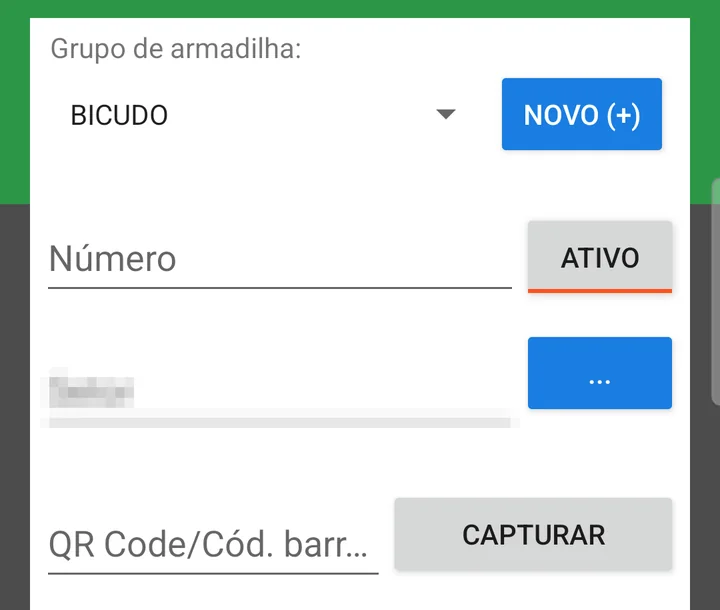
The NEW TRAP (+) button, at the top of the list, registers a trap from the phone itself, right where it is being installed: you choose the group, the number, the sector and, if the farm uses it, the QR Code. The location comes from the device's GPS.
📊 What is it for?
The collection is the starting point for the system to turn raw data into useful information for the manager.
From the collections, the system:
- Automatically updates the pest dashboards and reports
- Shows maps with the geographic distribution of catches
- Shows week-by-week trend charts
- Points out trends, infestation peaks and comparisons by field or sector
This lets the manager judge whether it is time to step in, take preventive measures or apply, based on concrete data and not just on impressions.
📊 Related reports and dashboards
- MON.05.01 (formerly 002.P) - Trap scouting
- MON.05.02 (formerly 002.Q) - Trap scouting per week per sector
- MON.05.03 (formerly 002.R) - Trap scouting per week per field
- Trap trend
The Trap tab on the home screen
The portal's home screen has a Trap tab that brings together the collections from all traps in one place. It has its own filters — Season, Start date, End date, Sector and Trap Group — and two modes under Display mode: Map, which opens by default and places each collection at the point where the trap is, and Table, with one row per collection: group, sector, date, classification, field and quantity.
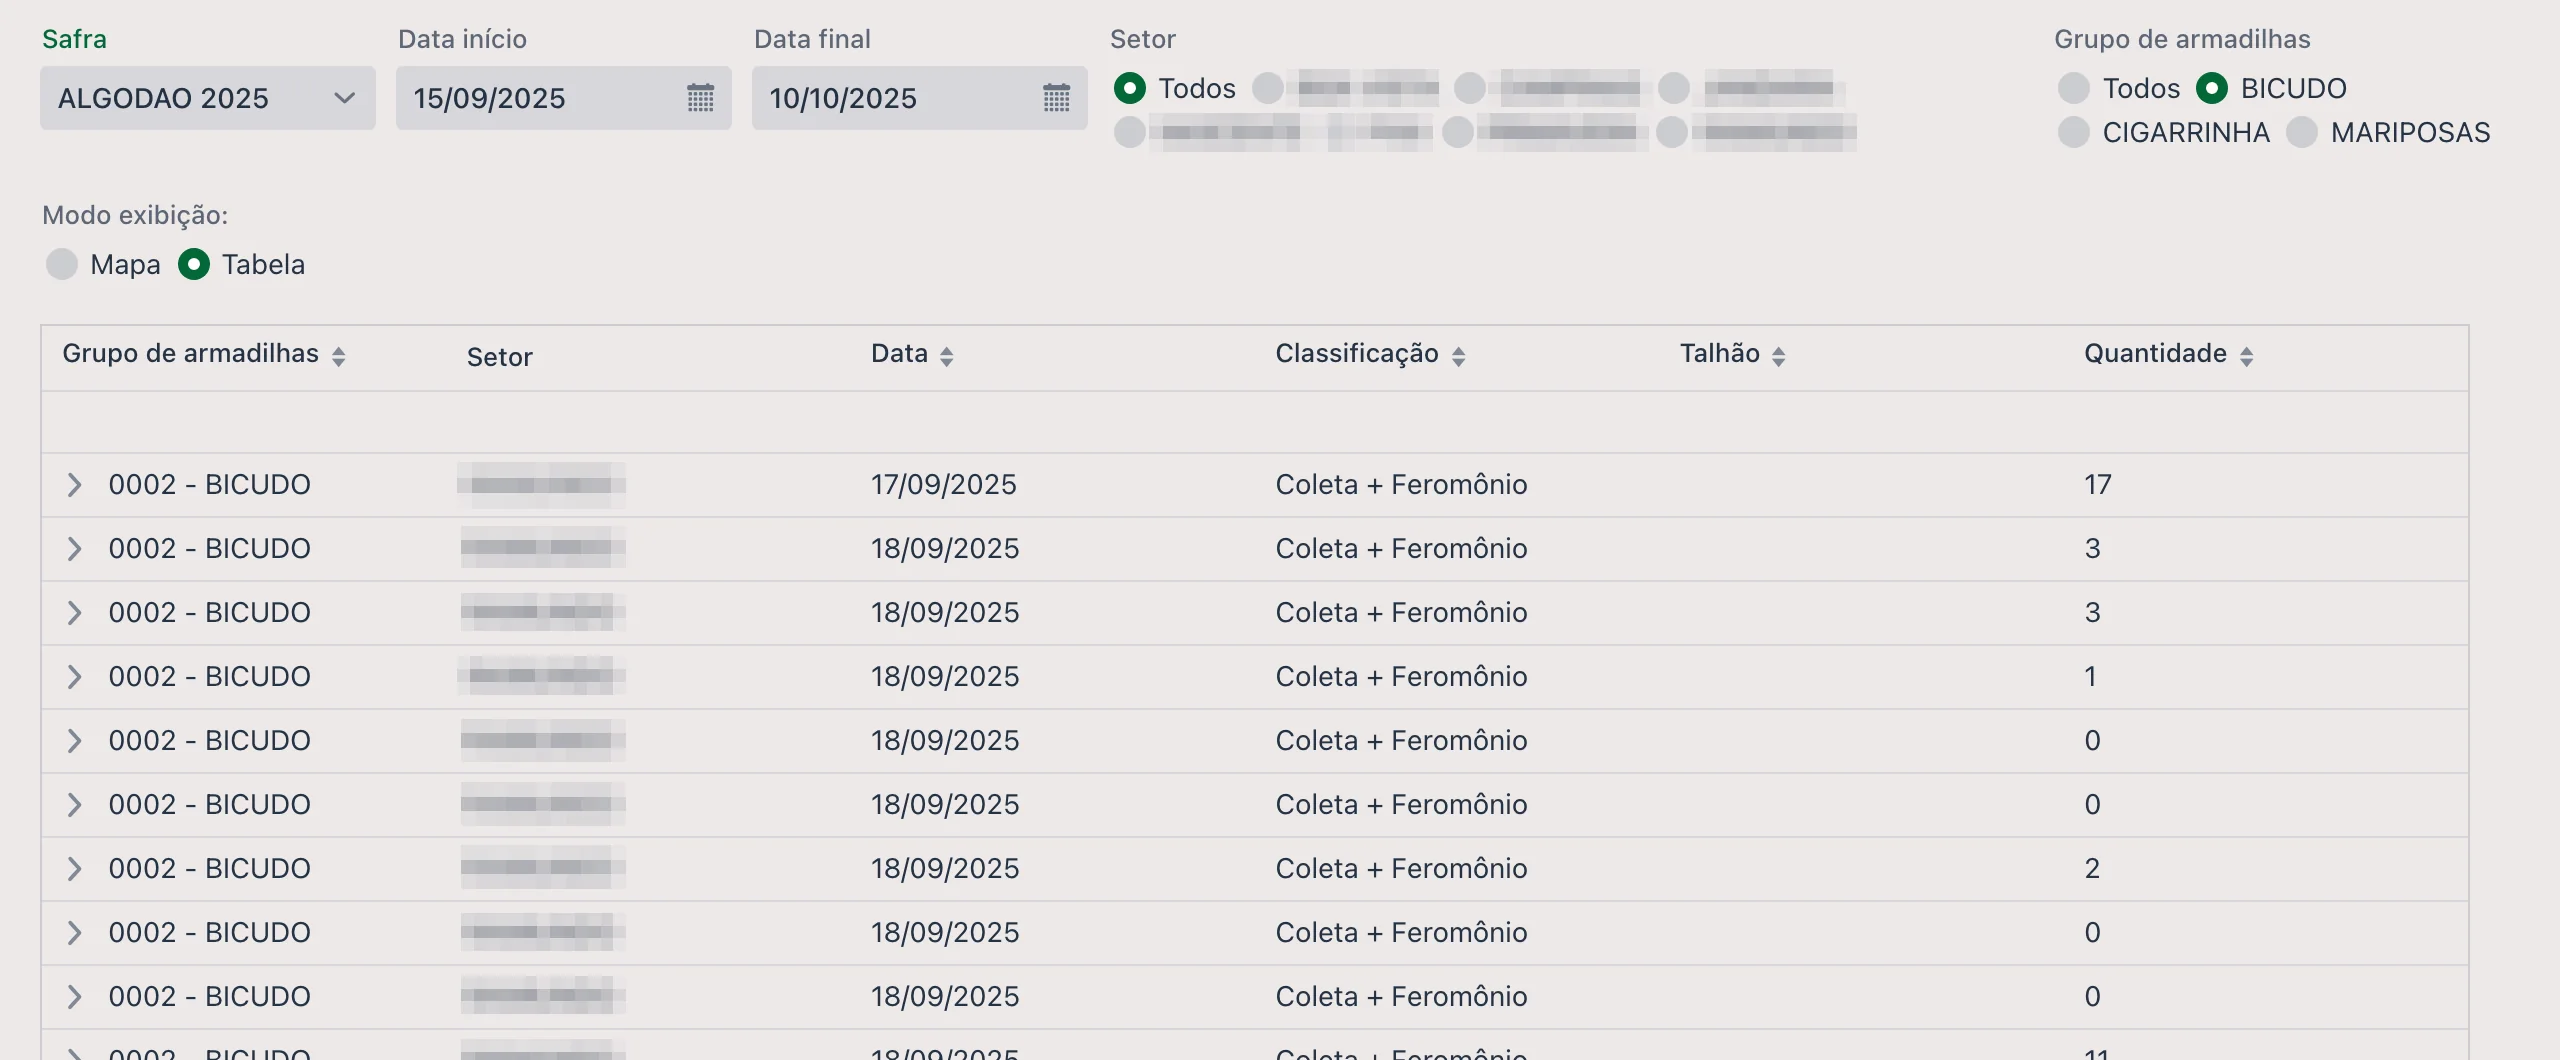
Besides these reports, the home screen has a dedicated tab, called Traps, for viewing the collections made.
- You can make collections directly in the app, including with GPS and OFFLINE
- The data will be organized by group, field and season
- Reports and dashboards will show the pests collected per point
- Electronic traps can be integrated into the system for automatic collection
❓ Frequently asked questions
What is an agricultural trap and what is it for?
It is a device installed in the crop to catch insects and identify which pests are present. Many use pheromone, a substance that attracts the target insect. They serve as monitoring: they help the grower know when and where the pest is showing up.
How many traps should I put per field?
Ideally, the traps should cover at least each side of a field. They are usually spread around the fields, so that the monitoring represents the area.
Do I need to register the traps again every season?
Yes — the record is per season, which is exactly what lets you compare history from one season to the next. Each trap is linked to the current season and to a trap group.
Can I use an electronic trap?
Yes. Once registered, the trap accepts manual collections through the app, manual entries through the web portal and also integrations with sensors or digital traps.
I checked the trap and there was nothing. Should I record it anyway?
Yes, and it matters. Enter the collection with Found? = No: that is what separates a trap that was checked and empty from one nobody went to check. Without that record, the trend chart has a gap that looks like no pests, when it is really no reading.
The system won't let me save the collection. Why?
Three rules block it: the date is required, the date cannot be later than today, and when you select Found? = Yes the quantity must be greater than zero.
I have the collections in a spreadsheet. How do I import them?
With the Import Collections from Excel button, on the trap list. The spreadsheet must be
.xls or .xlsx and have the required columns data (collection
date) and quantidade (numeric).
How does the operator find the right trap in the field?
Through the latitude and longitude, which guide the app to it, and through the QR Code, if you stick the label on the trap — then scanning the code is enough to open the collection for that trap, without searching by number in the list.