🌧️ Screen: Rain Gauge
The Rain Gauge screen lets you register fixed weather data collection points on the farm, whether they are Rain Gauges or Weather Stations.
📍 Location in the system
Menu: Crops > Rain Gauge
🧩 Main function
Lets you register the farm's rain gauges and weather stations, defining location, coverage and type of measurement (manual or automatic). These records are essential for:
- Historical weather analysis
- Agronomic decisions based on rainfall
- Technical monitoring of the fields
📝 Registration fields
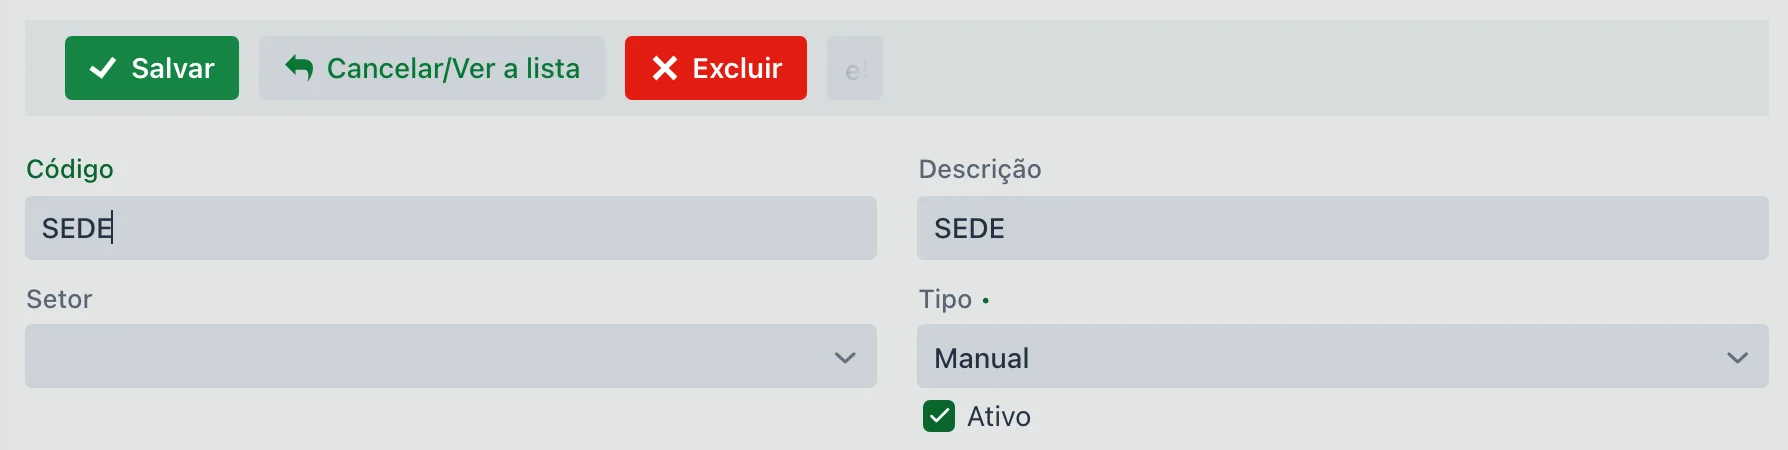
| Field | Description |
|---|---|
| Code | Identifier of the collection point. |
| Description | Name or identification of the rain gauge (e.g., South Station, TH01). |
| Sector | Internal grouping within the farm. |
| Type | Required. Manual, Davis V1 Station, Davis V2 Station or Agrosystem Station. It comes set to Manual. |
| Send to John Deere Operations Center | When checked, the rain gauge appears on the John Deere Operations Center map (Assets tab), with the rainfall and, for stations, the weather, updated every 30 minutes. It must be active, have latitude and longitude (Location tab), and the farm must be linked to the John Deere organization. See How the John Deere integration works. |
| Active | Defines whether the point is still available for new collections. |
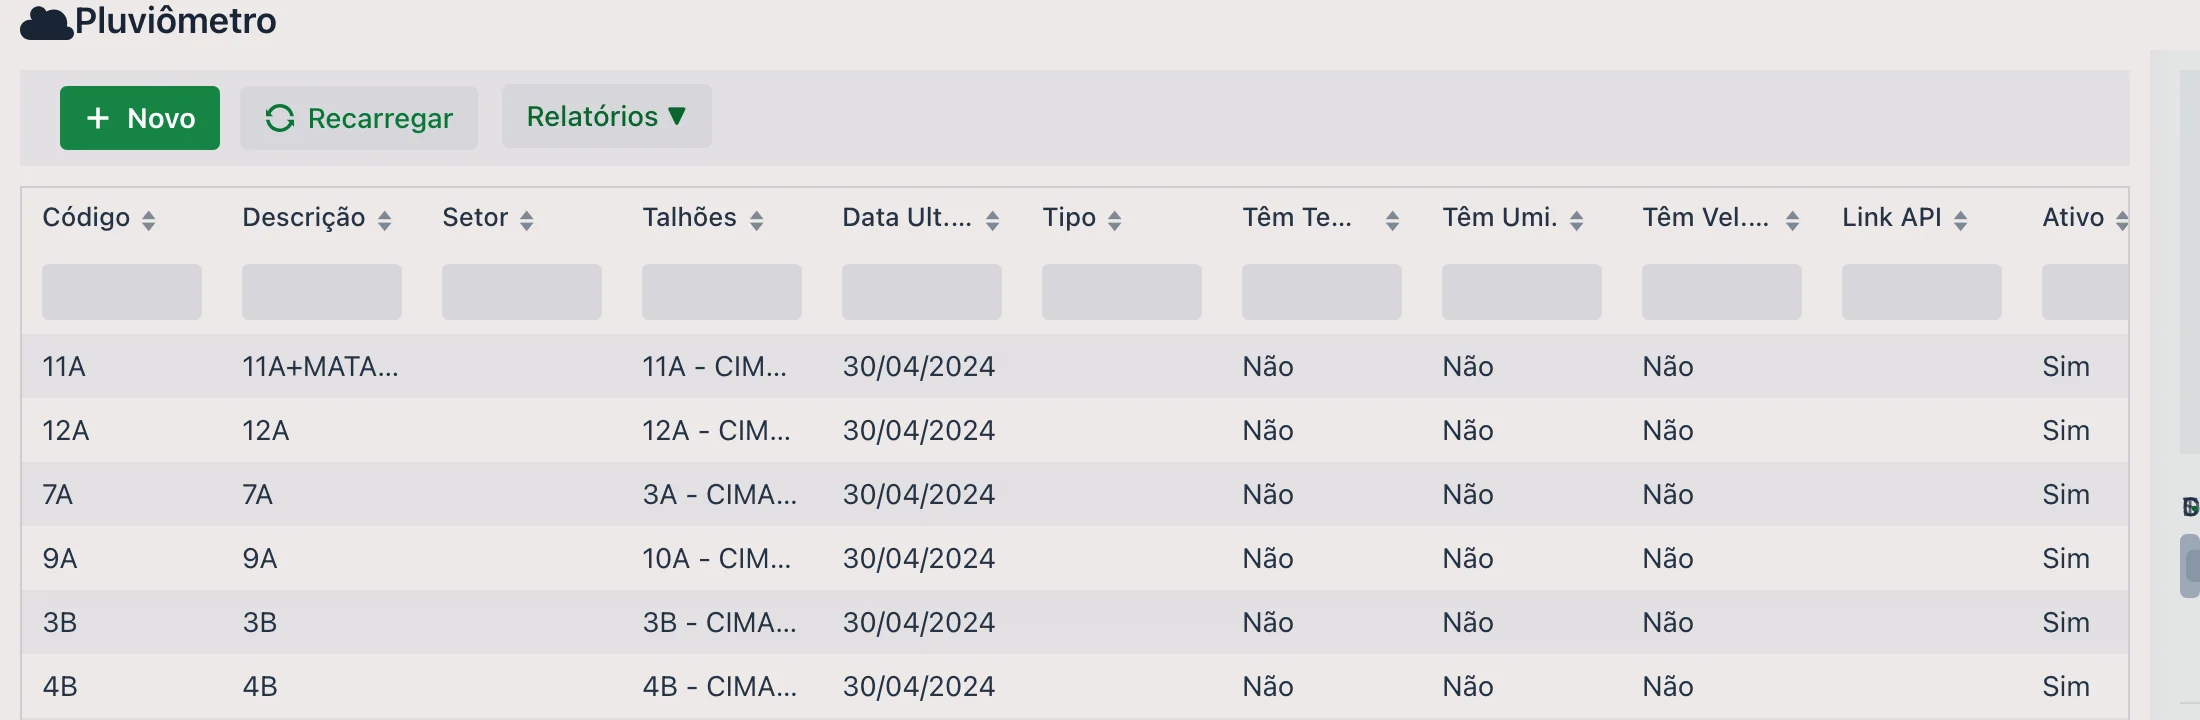
The list shows Code, Description, Sector, Fields, Last Collection Date, Type, Has Temp., Has Hum., Has Wind Speed, API Link and Active, each column with its own search box. The Last Collection Date is the shortcut to find out which rain gauge stopped being read. The Reports ▼ button, at the top, opens the reports linked to the screen.
Fields that only appear for stations
When you choose a type other than Manual, the screen shows the integration fields — which stay hidden for a manual rain gauge:
| Field | Description |
|---|---|
| Key / Secret / API Link | Station access credentials, provided by the manufacturer or by the upCampo team. |
| Has Temp. / Has Hum. / Has Wind Speed | Check what that station measures: temperature, humidity and wind speed. A station that only measures rain keeps all three unchecked. |
🗂️ Available tabs
1. 🌾 Field
Lists the fields covered by this rain gauge. This ensures that, when you look up data for a field, the system knows which station to use as the reference.
You can link one field at a time, choosing it in the Field box and saving, or use the Import button: it opens the farm's list of fields, with Description, Sector and Code, so you can check several and bring them all in at once with Import selected.
2. 📍 Location
Defines the latitude and longitude of the point, allowing it to be shown on the map and used with GPS in the app.
- It can be filled in manually or captured through the app with geolocation
3. 🌧️ Collections
Lets you record rainfall collections:
- Manually in the web portal
- Automatically through the station integration
- Through the app, entering the rainfall volume collected
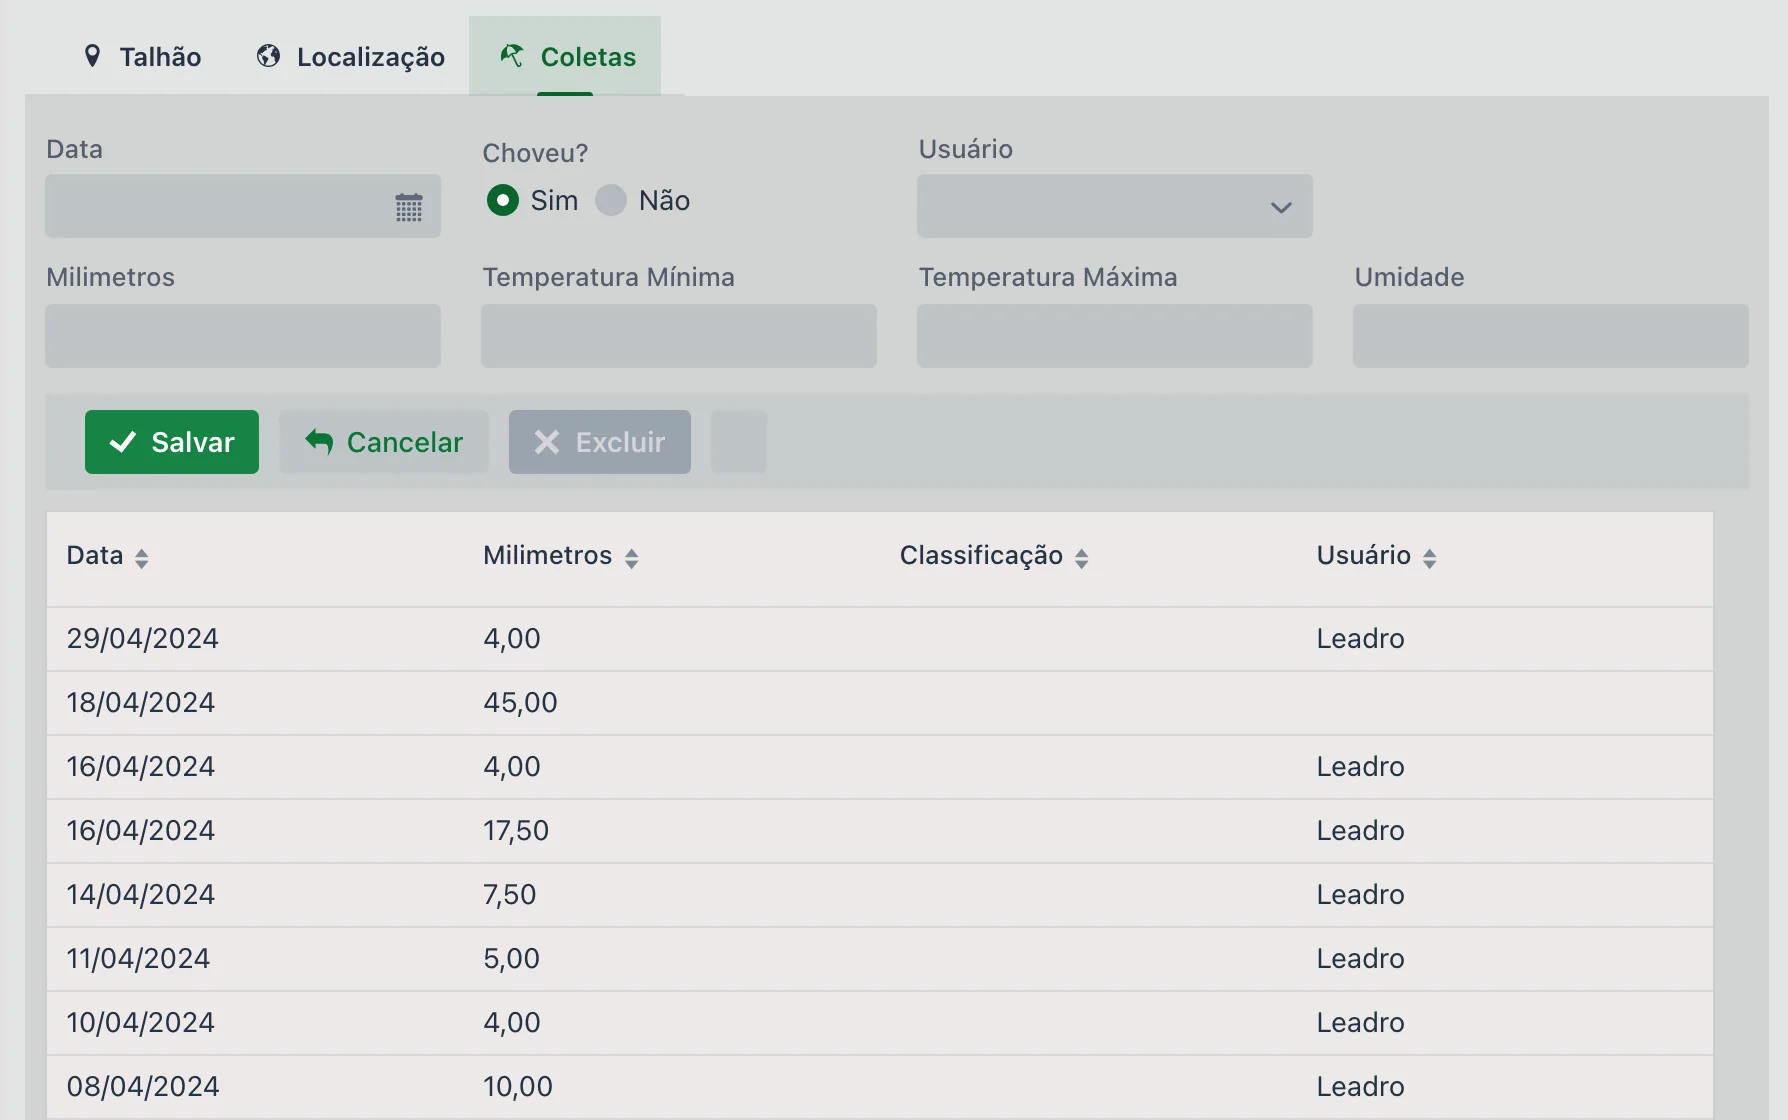
Each collection records:
| Field | Description |
|---|---|
| Date | Required. Day of the reading. |
| Rained? | Yes or No — it comes set to Yes. This choice defines the rest of the form (see below). |
| User | Who took the reading. |
| Minimum / Maximum Temperature | Temperatures for the day, when measured. |
| Humidity | Air humidity recorded. |
- Rained? = Yes → Millimeters appears, so you can enter the volume
- Rained? = No → Millimeters disappears and the weather Classification appears in its place: Sunny, Cloudy (few clouds), Cloudy (many clouds) or Thundering
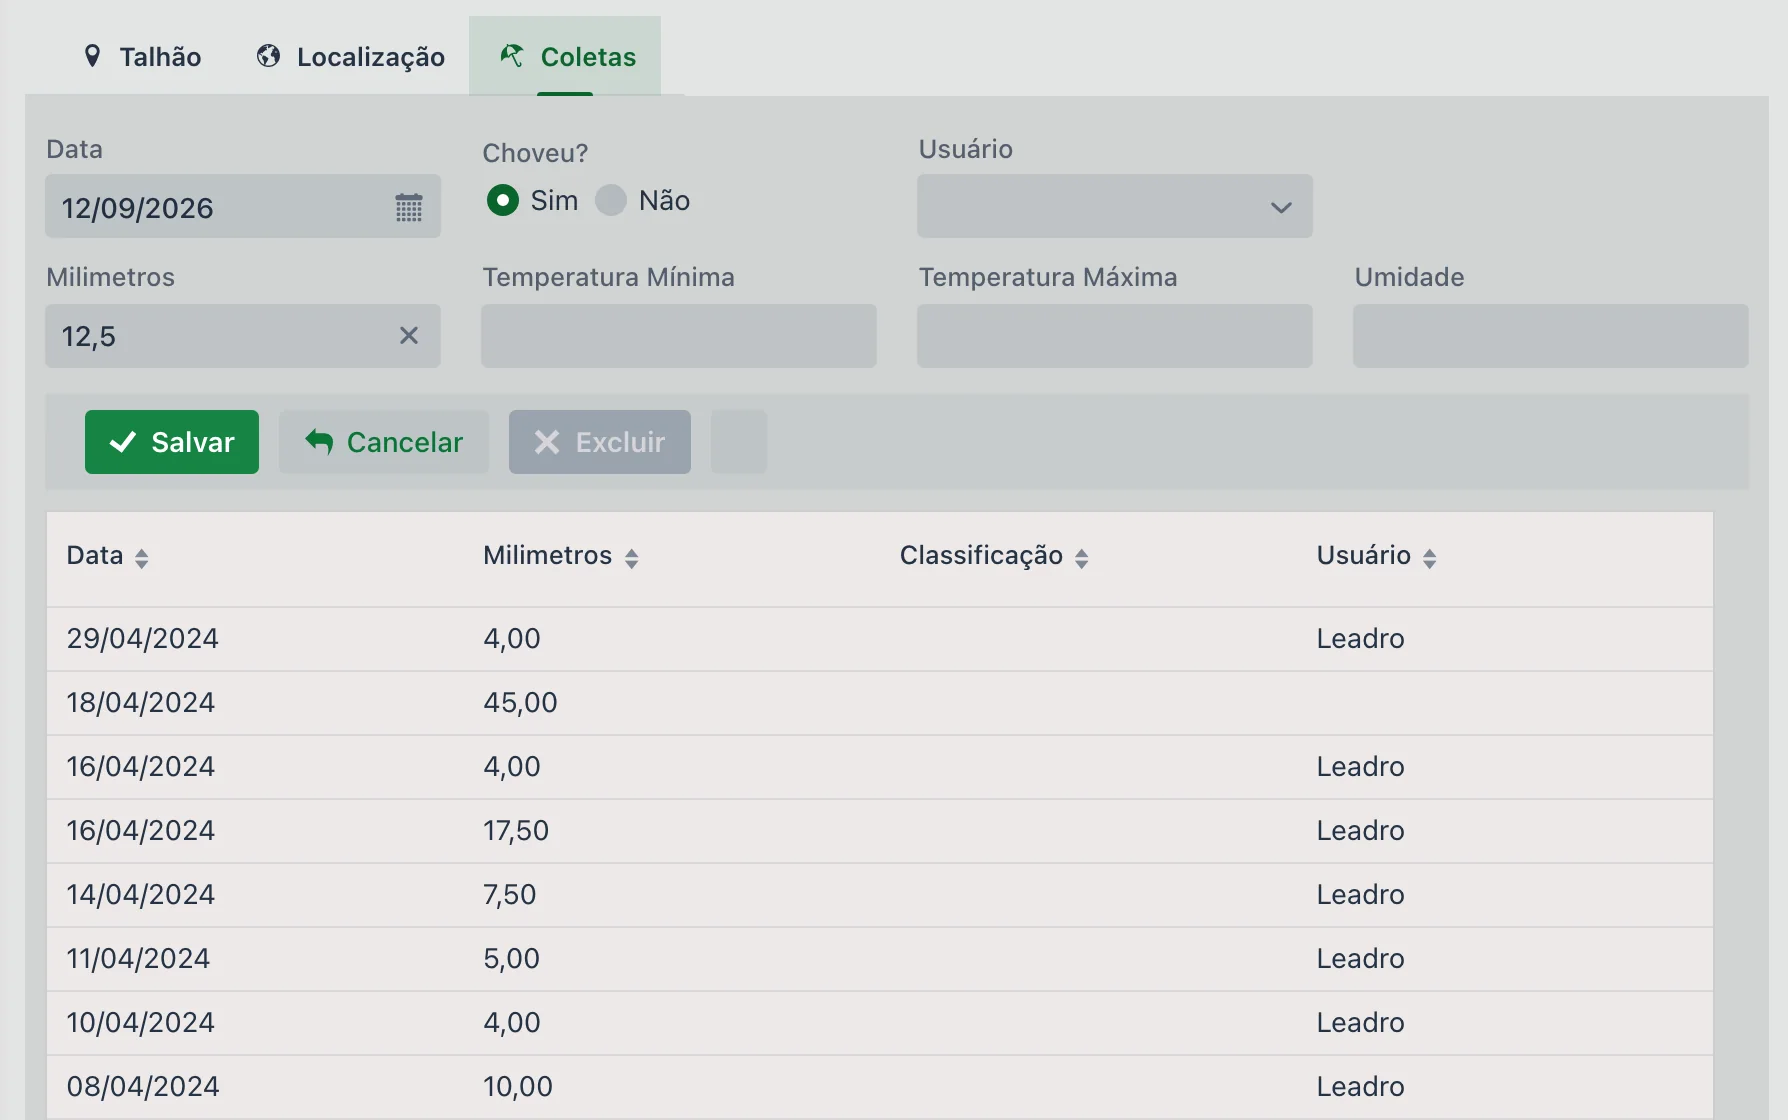
Recording rainfall, step by step
- Open the rain gauge in the list and go to the Collections tab.
- Fill in the Date of the reading.
- With Rained? set to Yes, enter the Millimeters. If it did not rain, select No and choose the weather Classification.
- Click Save, on the Collections tab bar.
📱 The rain gauge in the app
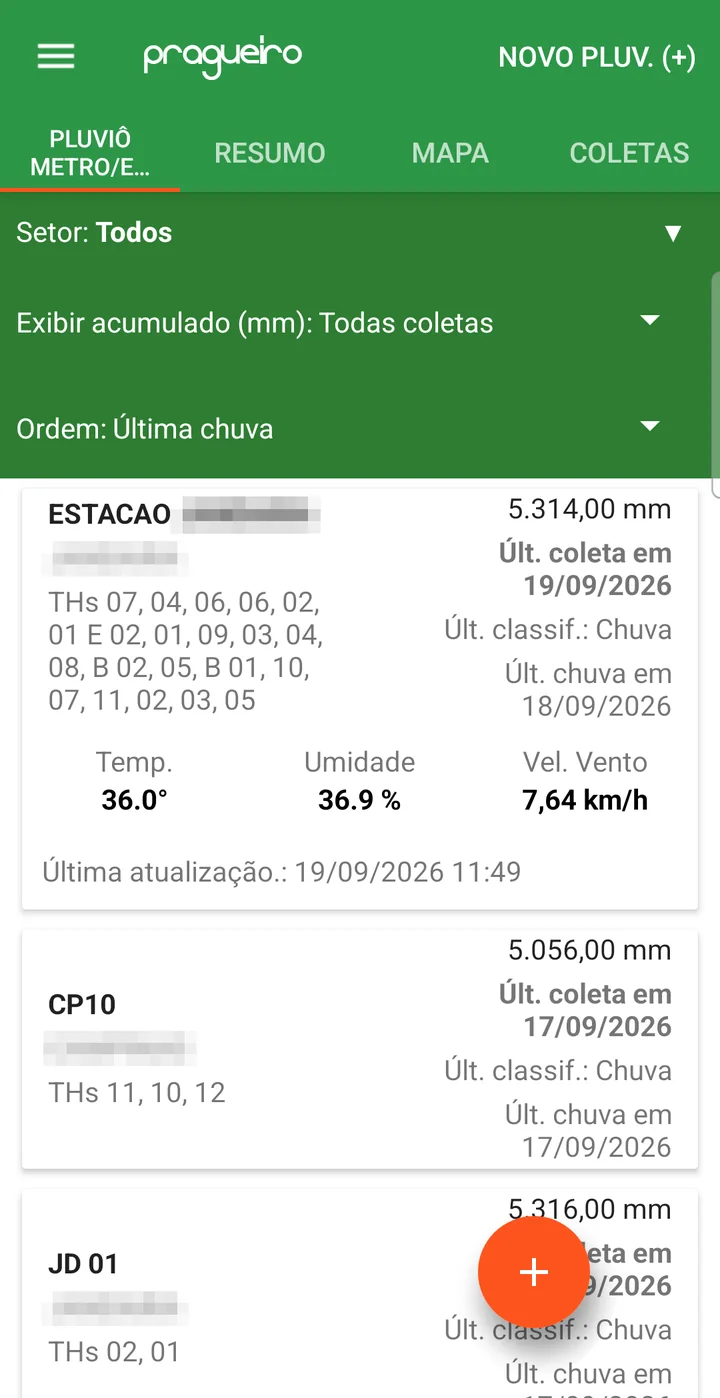
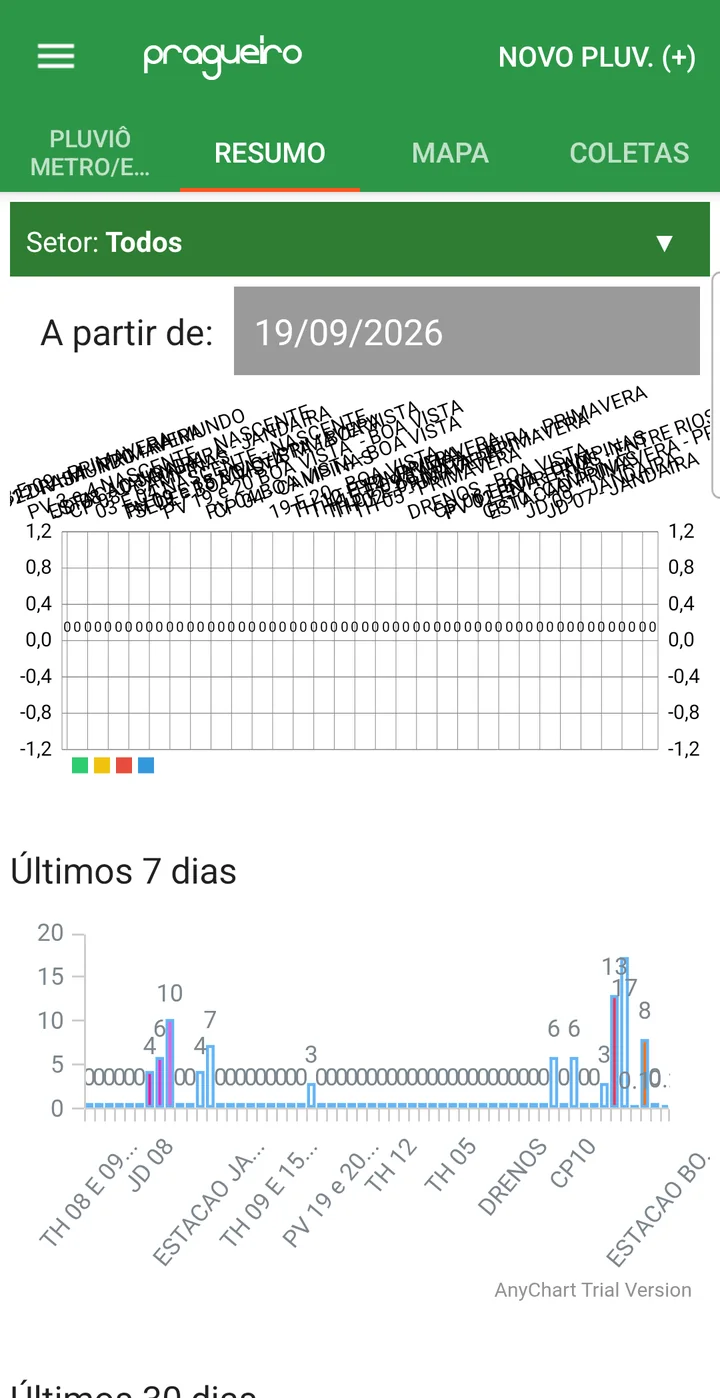
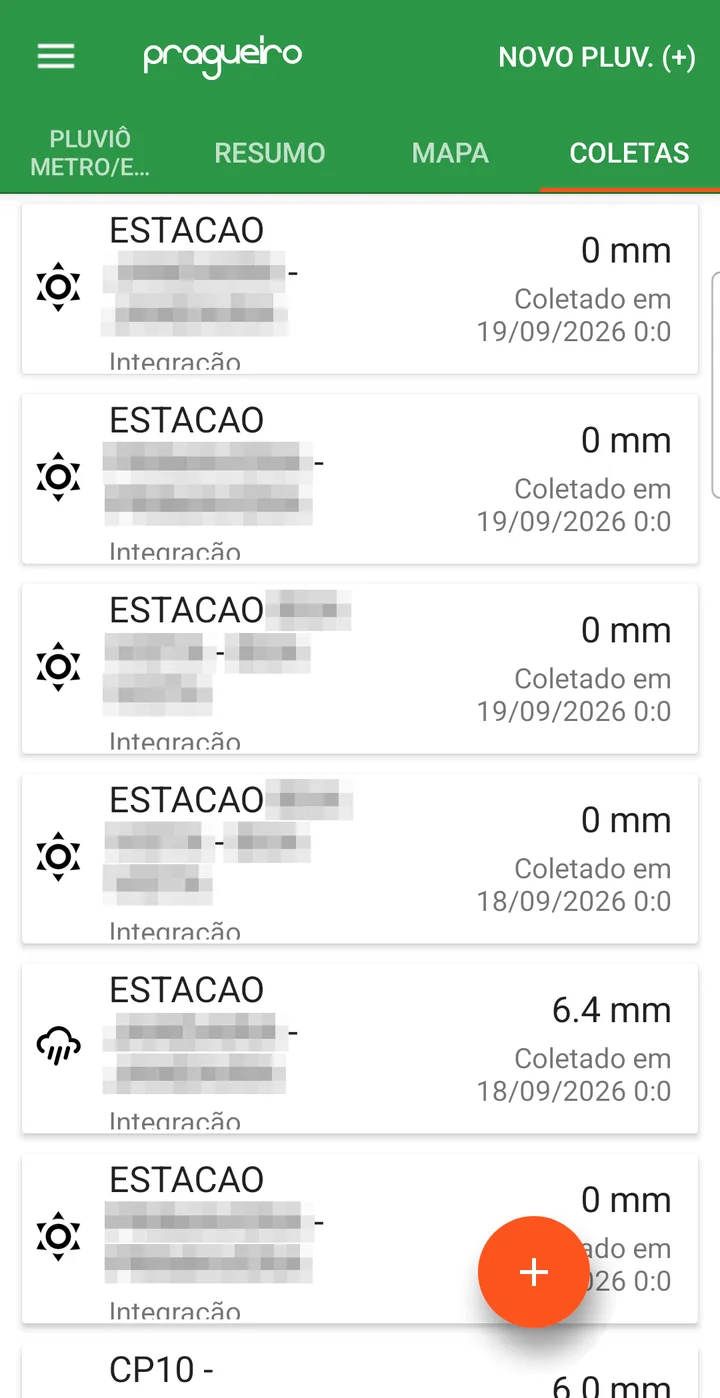
In the field, the reading is entered through the upCampo app, in the Rain Gauge/Station menu. The list shows each rain gauge and station with the accumulated millimeters, the date of the last collection and of the last rain, and the fields it covers; stations also show temperature, humidity and wind. The other tabs are SUMMARY (rainfall charts per rain gauge), MAP and COLLECTIONS (the most recent readings from all of them).
Recording rainfall in the app
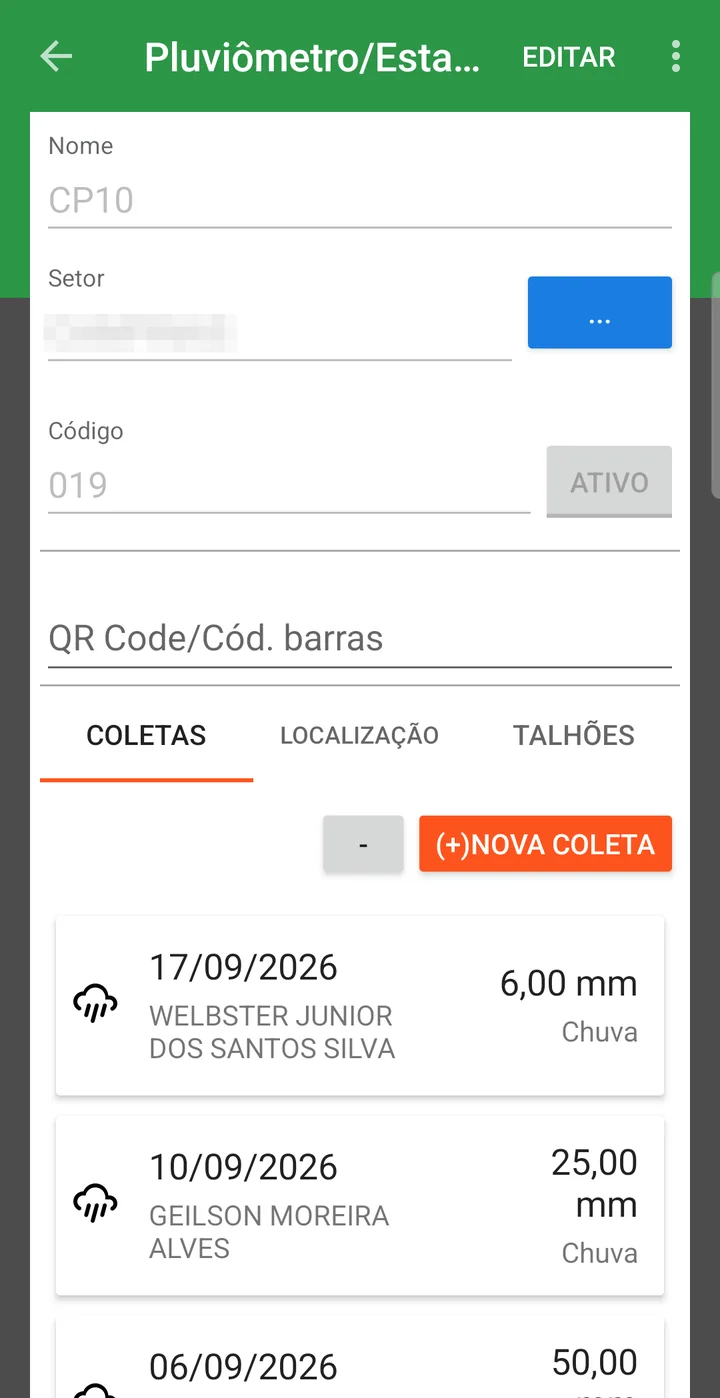
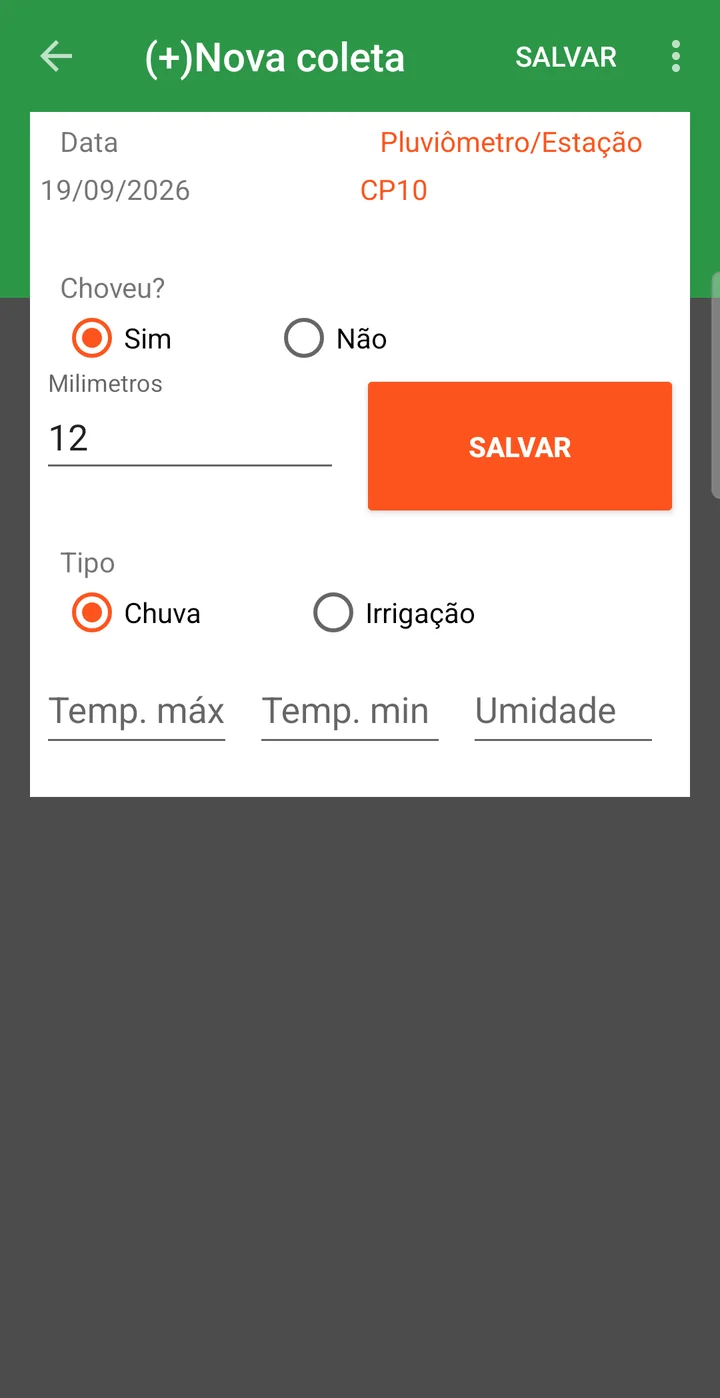
- Tap the rain gauge in the list and, on the COLLECTIONS tab, tap (+)NEW COLLECTION.
- Check the Date, leave Rained? set to Yes and enter the Millimeters.
- Select the Type — Rain or Irrigation — and, if you have them, the maximum temperature, minimum temperature and humidity.
- Tap SAVE.
📊 Reports and dashboards
Available reports:
Gives an overview of the collections made per rain gauge.
Details each collection with date, volume and source (manual or automatic).
Weather & Stations & Rain Gauges dashboard
On the platform's home screen, there is a dashboard dedicated to weather tracking:
- It shows the rain gauges on a map with the rainfall recorded at each location
- It also offers a table view with historical data
Rainfall ranges
To classify rainfall as low, medium or high, the system uses:
- An automatic average based on the minimum and maximum values recorded
- Or ranges defined manually on the company settings tab
- You will have organized, historical rainfall data
- Reports and dashboards will bring data per field automatically
- Weather-based decision-making will be more accurate
- It enables integration with automatic weather stations
❓ Frequently asked questions
How do I record the farm's rainfall in the system?
On the rain gauge's Collections tab. It can be recorded in three ways: manually in the web portal, through the app in the field, or automatically, when the point is an integrated weather station.
What is the difference between a rain gauge and a weather station in upCampo?
It is the Type field in the record. A Manual rain gauge depends on someone recording the reading; stations — Davis V1, Davis V2 and Agrosystem — send data automatically through integration and require a key, secret and API link. In both cases the record is created on this same screen.
My station measures temperature and wind. Do I need to set anything up?
Yes: check Has Temp., Has Hum. and Has Wind Speed according to what that equipment measures. These options only appear when the type is a station, and they are what make the system expect (or not) that data in the integration.
How does the system know which rainfall to use for each field?
Through the Field tab, where you list the fields covered by that collection point. That link is what makes the reports bring rainfall per field automatically.
How do I record a day without rain?
Select Rained? = No in the collection. The Millimeters field disappears and the weather Classification appears in its place — Sunny, Cloudy (few clouds), Cloudy (many clouds) or Thundering. Don't enter zero millimeters with "Yes": the system refuses it, because with "Yes" the volume must be greater than zero.
How do I link several fields to the same rain gauge at once?
On the Field tab, use the Import button: it opens the farm's list of fields so you can check as many as you want and confirm with Import selected. One at a time also works, through the Field box.
How do I find out which rain gauge stopped being read?
Through the Last Collection Date column in the list, which shows the date of the last reading for each point. Sorting by it brings the forgotten rain gauges to the top.
How does the system classify rainfall as low, medium or high?
By default it uses an automatic average, calculated from the lowest and highest values recorded. If you prefer your own criteria, define the rainfall ranges manually on the company settings tab.