🐛 Quick Guide - Pest Monitoring
Pest monitoring — or IPM, integrated pest management — is going out to the field to find out what's happening inside the field before deciding whether it's worth spraying. The scout walks into the crop, covers the area and stops along the way; at each stop, they look at the plants around them and record what they found. In upCampo this record is made on the phone, stop by stop, and the web portal combines it all into one number per field — the number the agronomist compares with the action threshold to decide whether it's time to spray.
If you've never seen this whole flow, it works like this:
- The scout goes out to the field with the app on their phone. They pick the field and start walking it.
- At each stop, they open a point and record what they saw: the crop stage, the plant phenology and the count of pests found.
- Back in signal range, the phone syncs. All the points in that field on that day make up one scouting record.
- The web portal calculates the field result and compares it with the action threshold the farm registered for that pest, crop and stage.
- The agronomist reads the result on the scouting panel and decides: spray, wait, or scout again in two days.
The field app
Data collection happens in the upCampo app, installed on the scout's phone:
- 📱 Download on Google Play (Android)
- 📱 Download on the App Store (iPhone)
The login is the same as the web portal — the scout signs in with the username and password they already use in the system; there's no separate registration for the app. What must exist is access granted: a user created for them in Users, with permission on the farm they'll scout. Without that, the app opens but shows no fields.
And it works without internet. Fields rarely have signal. The app stores everything on the device and syncs on its own when the connection comes back, so the scout doesn't need to worry about coverage in the middle of the crop.
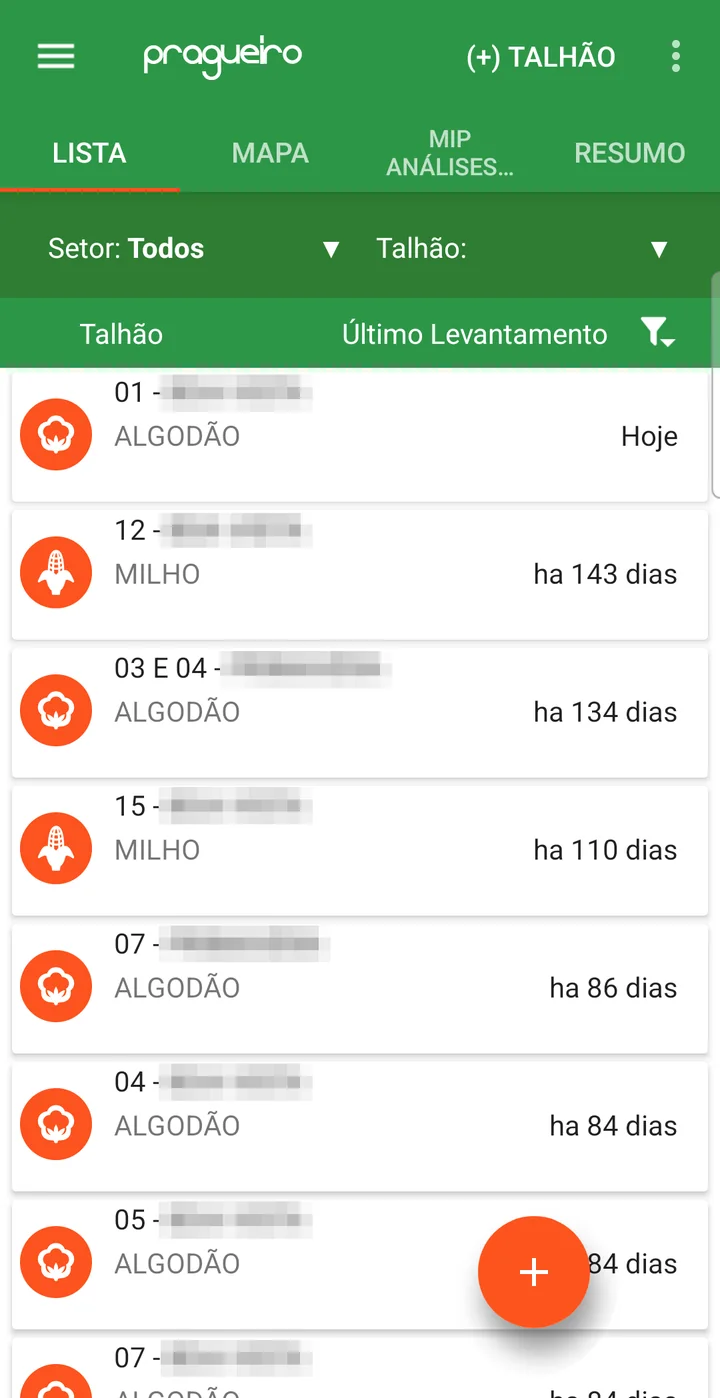
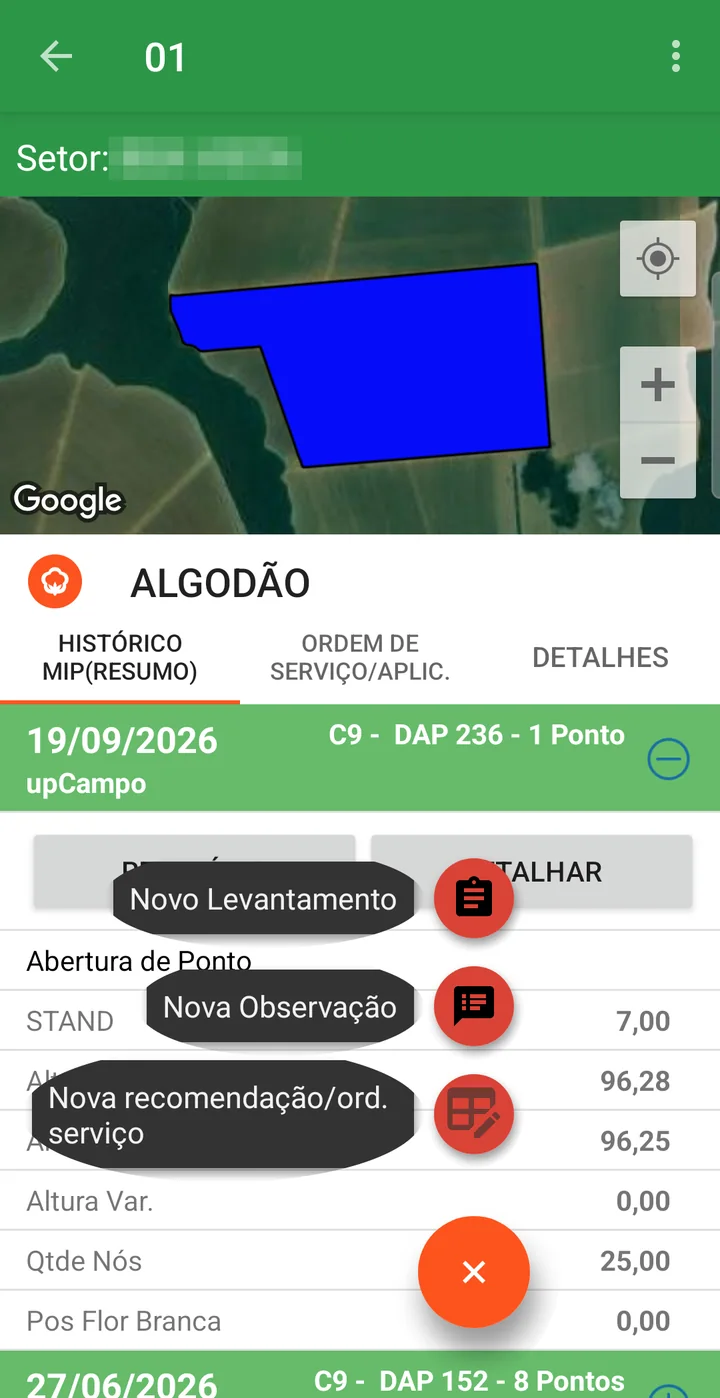
In the app, monitoring is under the Scouting (IPM) menu. The list shows the season's fields with the crop and how long ago each one was last scouted. The scout taps the field, then the orange + button and New Scouting.
What gets recorded at each stop
There are two moments, always in this order: first the point opening, then the pest count.
The point opening records how the crop looks at that spot, and brings together two pieces of information:
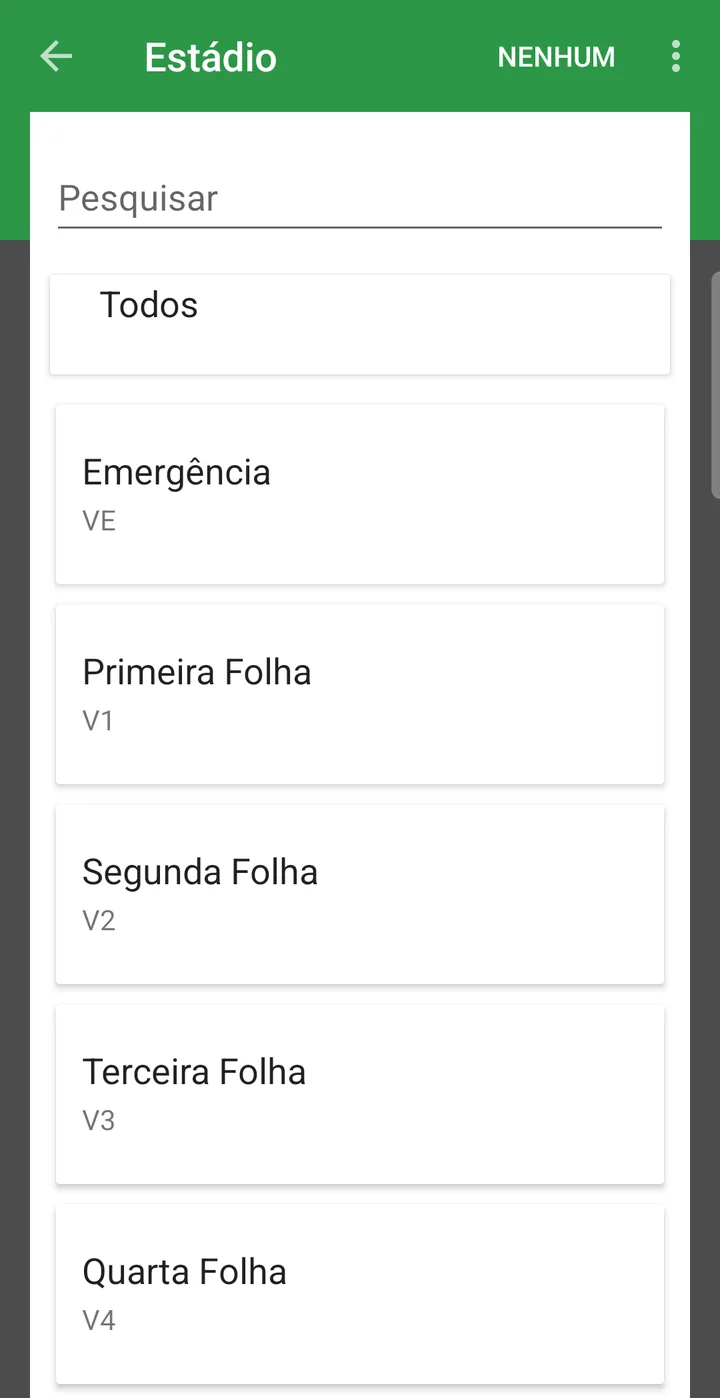
- The crop stage — where the plant is in its cycle: V4, R5, and so on. This isn't red tape: the stage entered at the opening decides which action threshold range applies, because two caterpillars per meter mean different things at different points in the crop.
- Phenology — measurements of the plant itself, not the pest: height, number of nodes, internode length, stand, plants per meter; in soybeans, pods and seeds per pod; in cotton, squares, bolls and open bolls. This is what lets you track whether the crop is growing as expected for that variety.
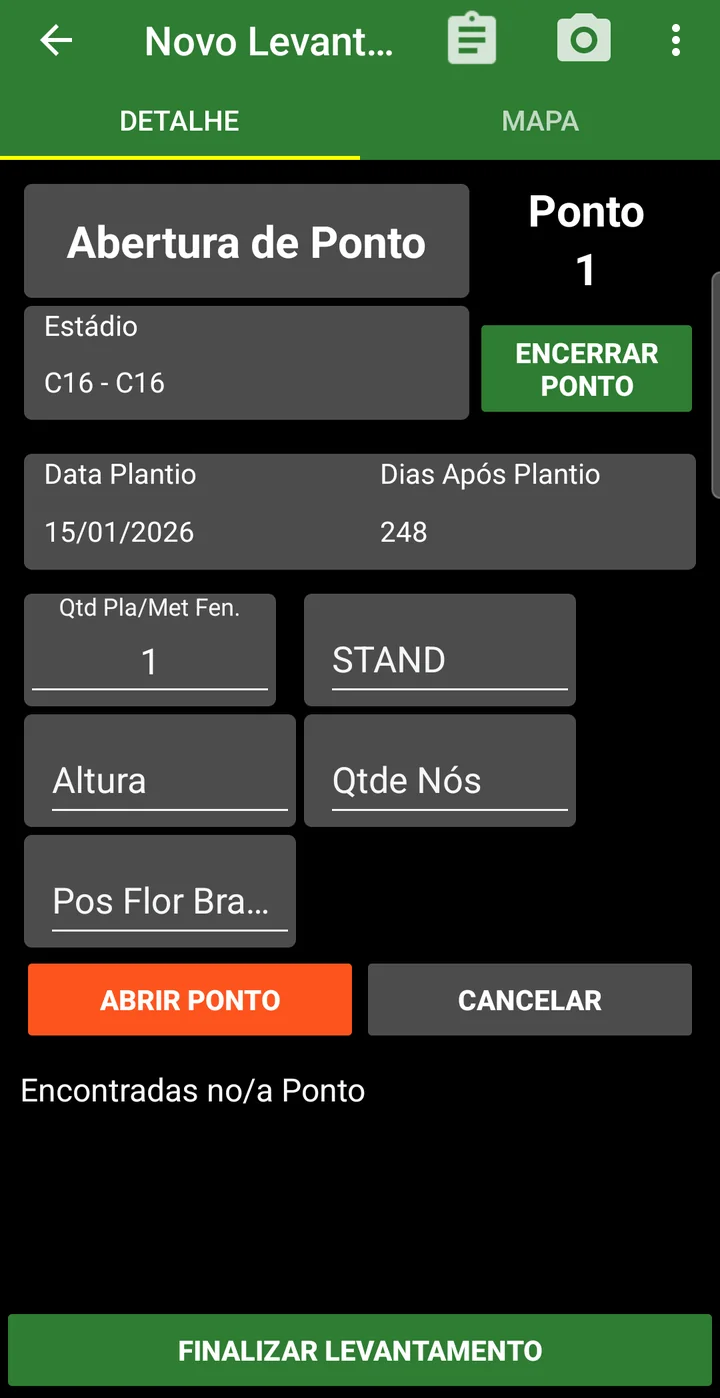
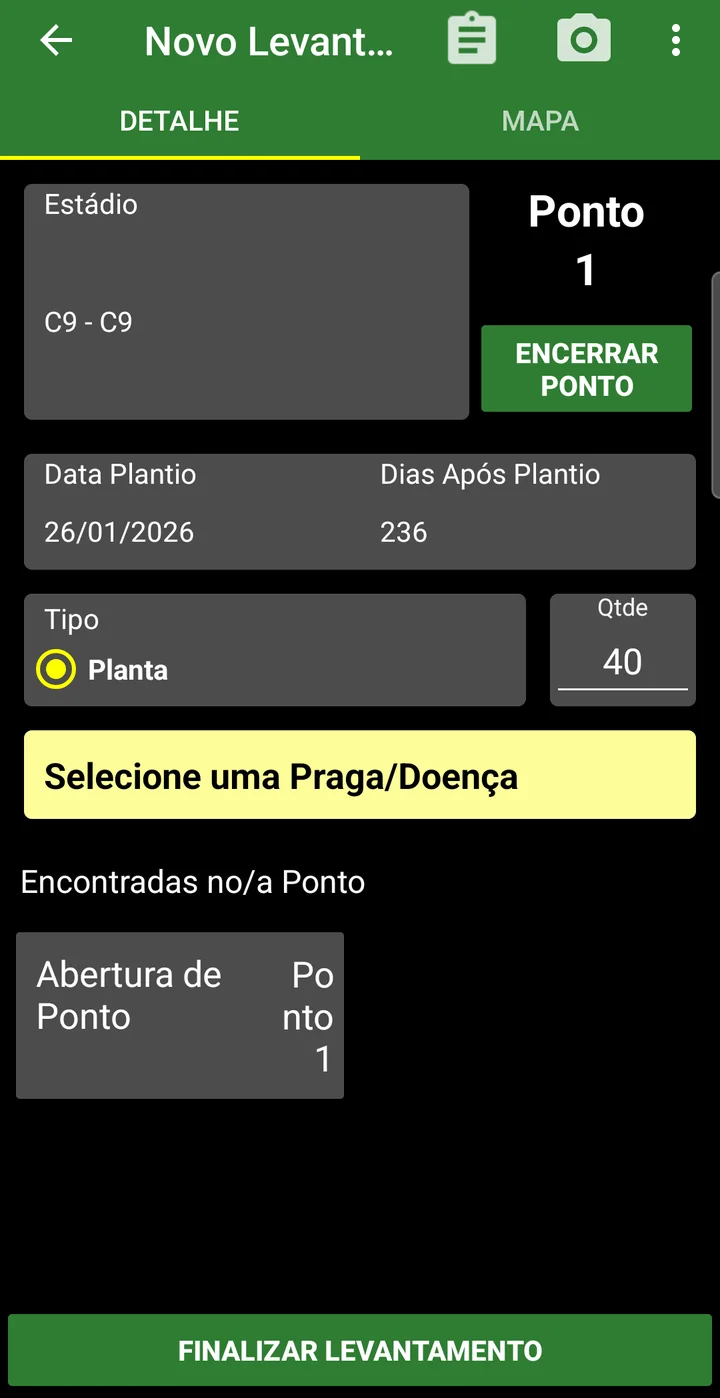
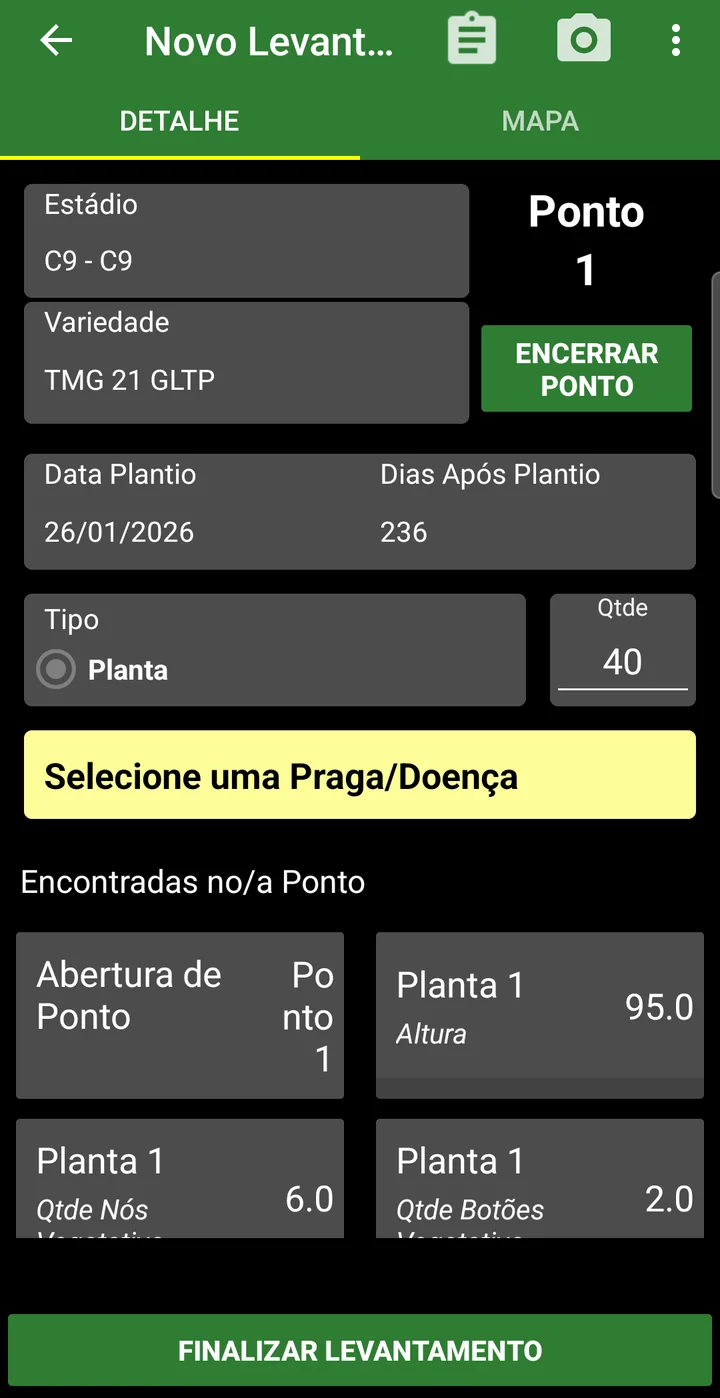
In the app, the new point opens in the Point Opening block: the scout picks the Stage from a list, fills in the plant measurements and taps OPEN POINT. The screen already shows the Planting Date and Days After Planting, which come from the Season Planting.
Which measurements appear depends on the crop. Each opening field is turned on per crop in
File > Company/Crop Settings,
and can also be limited to a range of days after planting and to certain points of the walk — all, only the
first, or a fixed interval. In the cotton season in the example below, besides Plants/m Phen.
and STAND, the scout enters Height, No. of Nodes and
White Flower Pos. — that's what cotton calls the field that appears as
1st node height in other crops.
The pest count comes next. For each pest found, the scout enters the counting method used, how many plants were checked, the pest, the size of the individual when it's counted that way — small, medium, large caterpillar — and the quantity. When the pest is registered with preset options, they don't type a number: they mark Low, Medium or High. The app stores the coordinate, time, who did it and photos along with it.
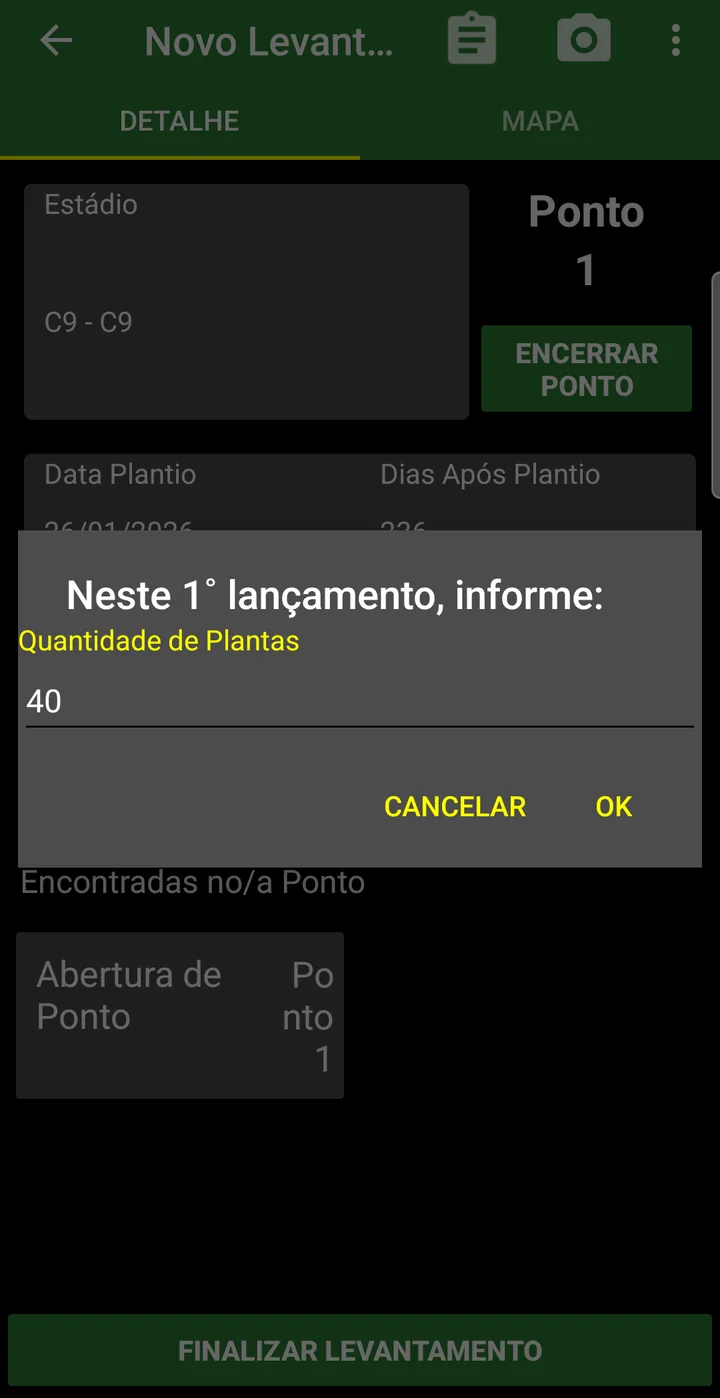
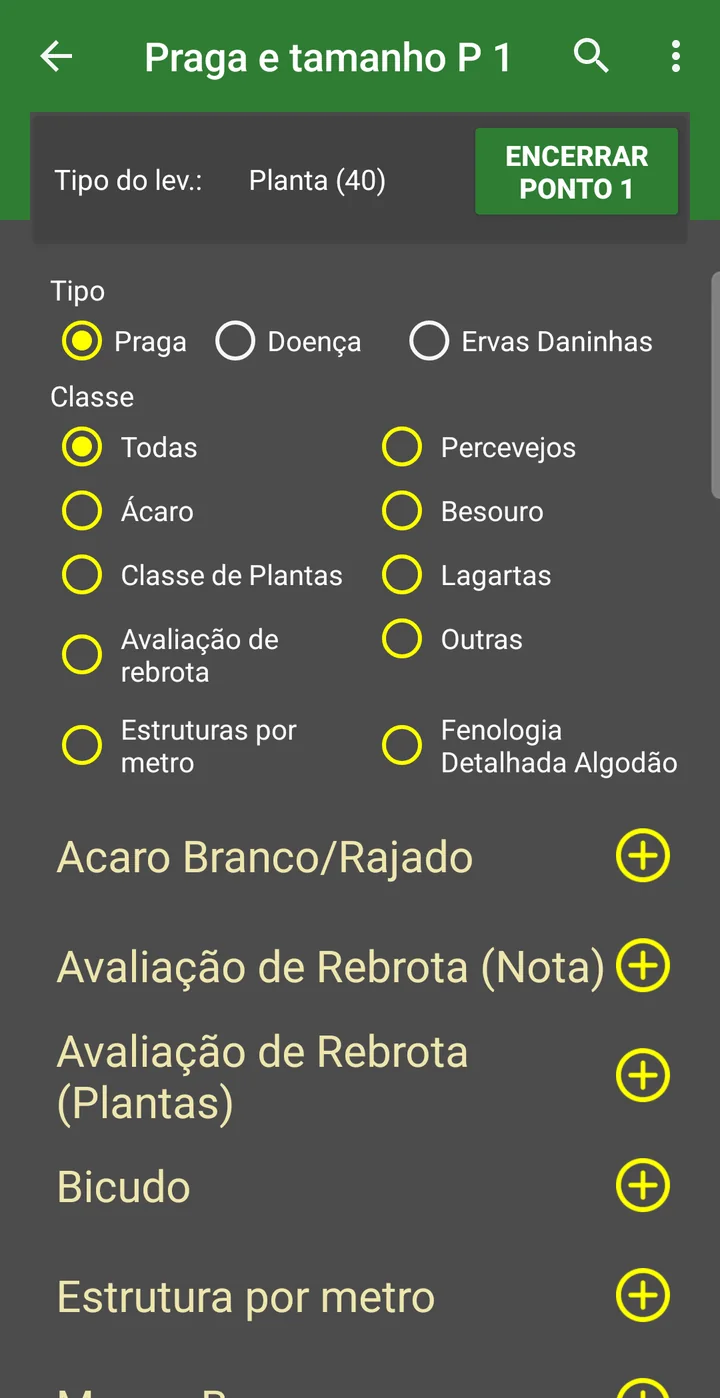
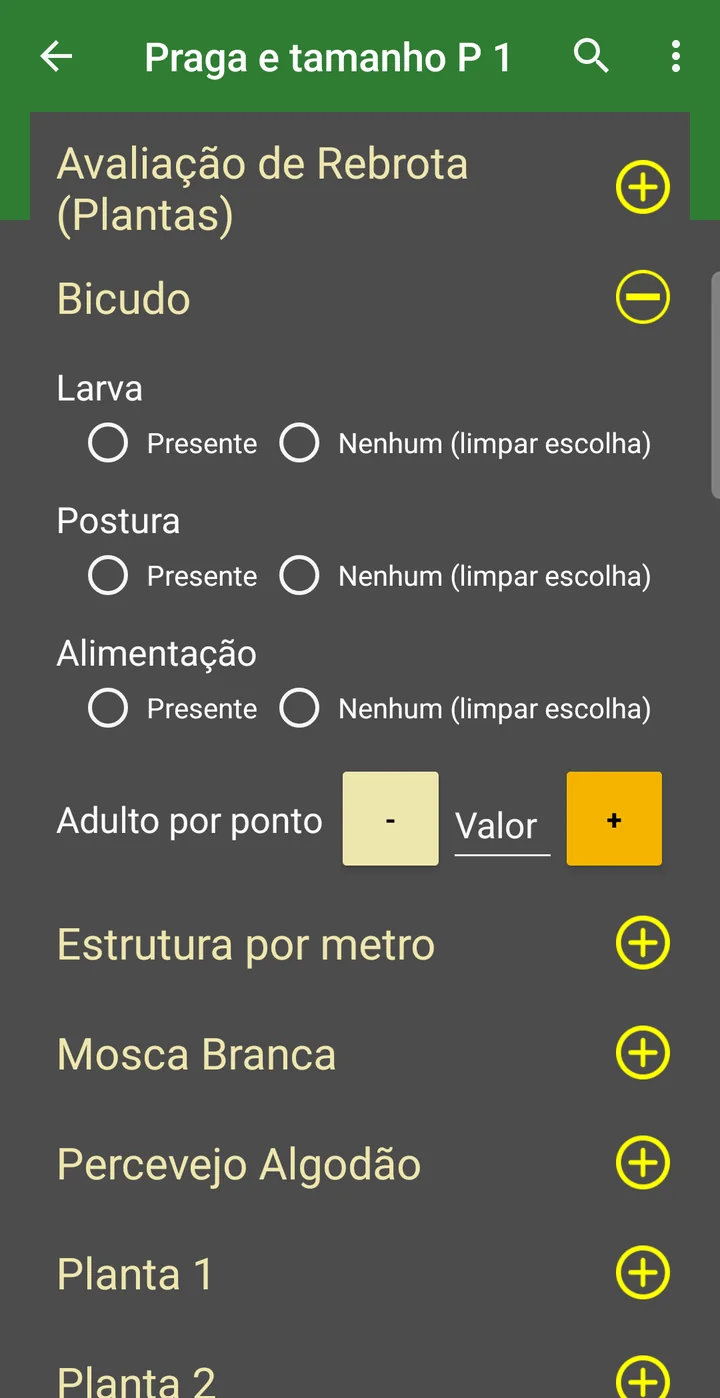
In the app, after the opening, the same screen shows the counting Type (Plant, with the number of plants checked) and the Select a Pest/Disease field. On the first entry of the point, the app confirms the number of plants; then it opens the pest list, filtered by Type (Pest, Disease, Weeds) and by Class. Each pest opens as an accordion with the counting fields — by size, with the preset options from the record, or by number, with the − and + buttons. CLOSE POINT is at the top of the screen, and FINISH SCOUTING at the bottom. Each pest has its own Save button, which appears after something is filled in: if you don't tap it, the count doesn't go into the point. The scout's step by step, from the field to the finished scouting, is in How to scout for pests and diseases in the app.
Detailed cotton phenology, node by node
In cotton, phenology can be recorded plant by plant and node by node, marking what's at each position on the fruiting branch. In the app, in the point's pest list, the Detailed Cotton Phenology class has the items Plant 1, Plant 2 and so on — one per plant checked. Tapping a plant opens its own screen:
- Enter the Height, Veg. Nodes Qty (vegetative nodes) and Veg. Buds Qty (vegetative buds).
- Tap + once for each fruiting node — − removes one. The + only works once the vegetative nodes are filled in. Total Nodes Qty is calculated automatically (vegetative + fruiting).
- Each fruiting node becomes a row in the grid, numbered from the last vegetative node — with 6 vegetative nodes, the fruiting ones are Node 7, Node 8, Node 9… —, with positions 1 to 5 on the branch.
- Tap each position until you reach what's there. Each tap moves to the next state, in legend order: Abs. (absent) → Square → Flower → Boll → Open (open boll) → Abor. (aborted) → back to Abs. The position's color shows the state.
- Tap SAVE and move on to the next plant.
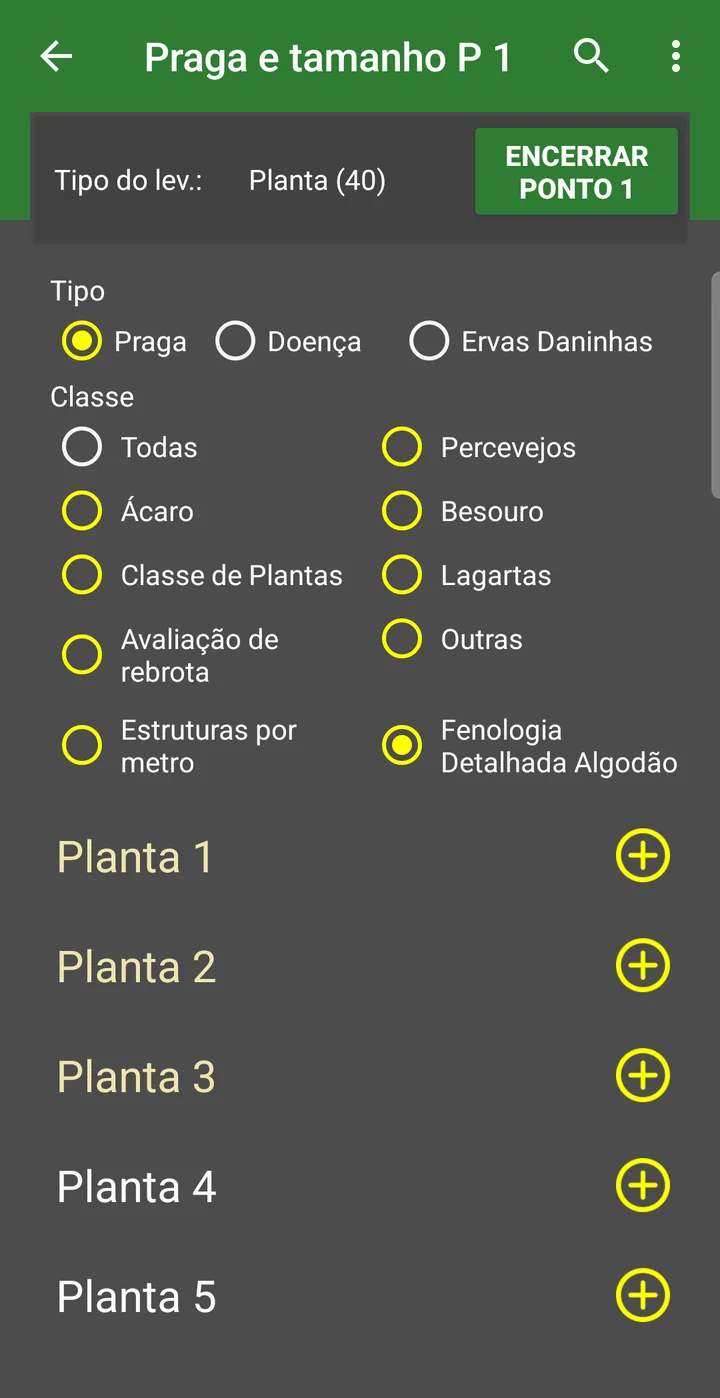
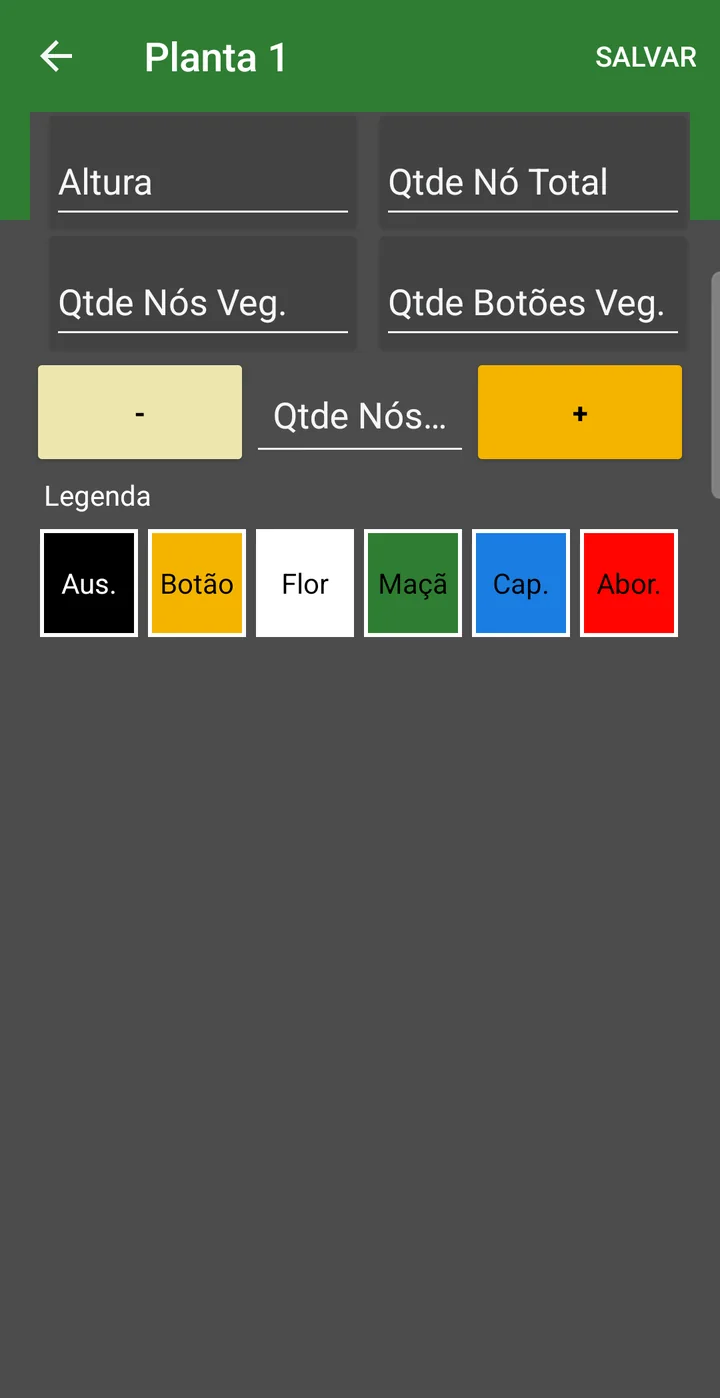
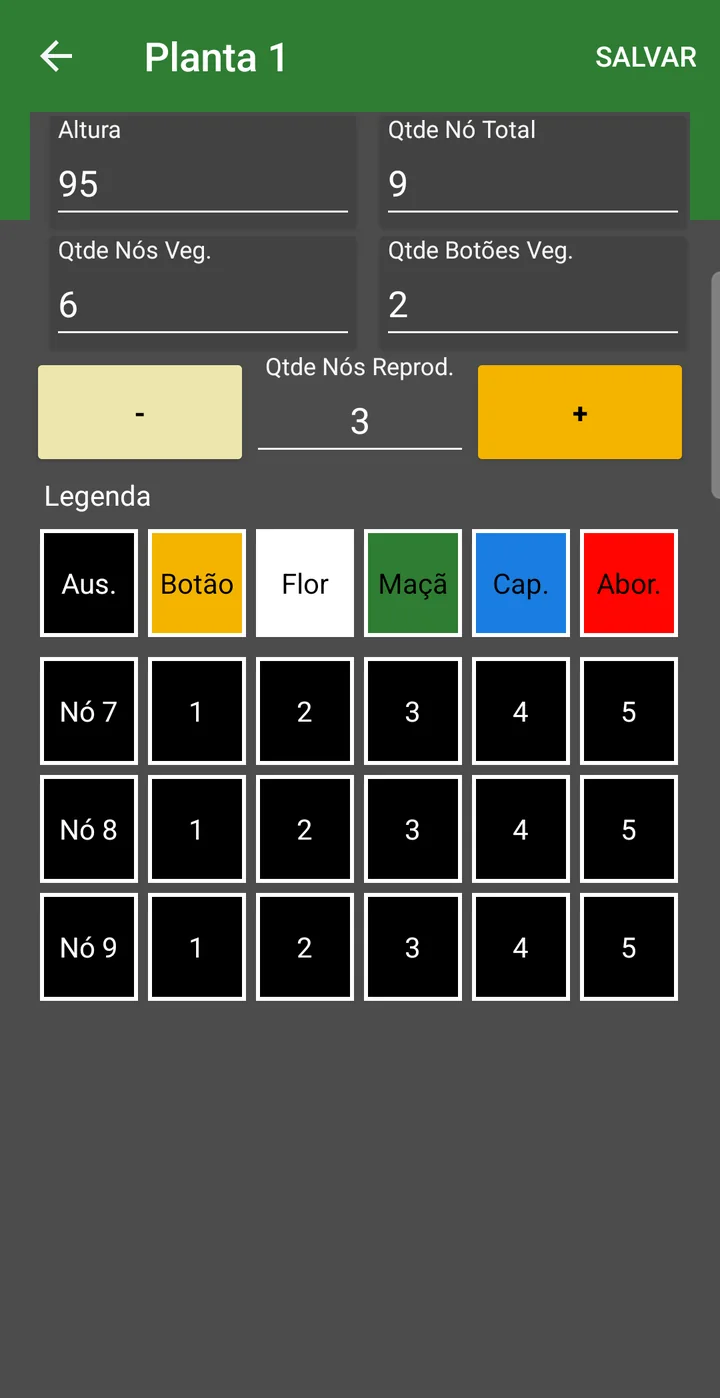
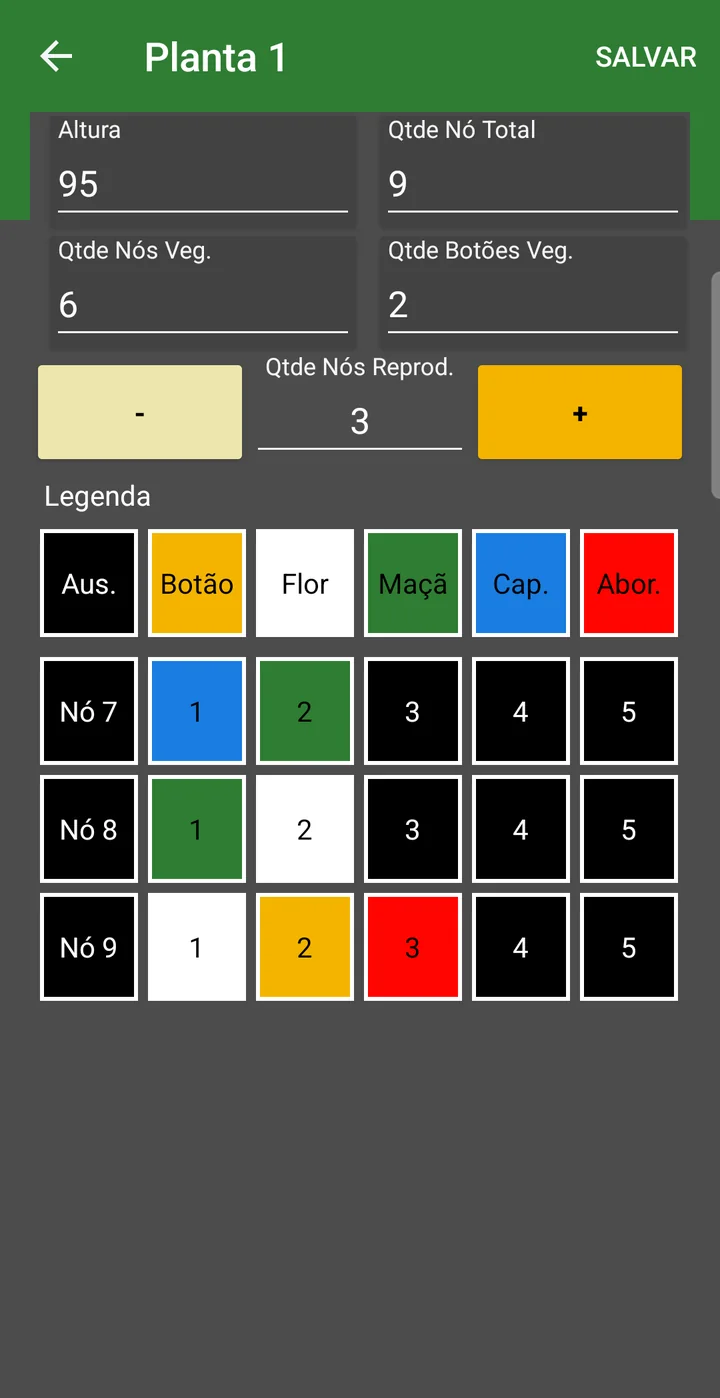
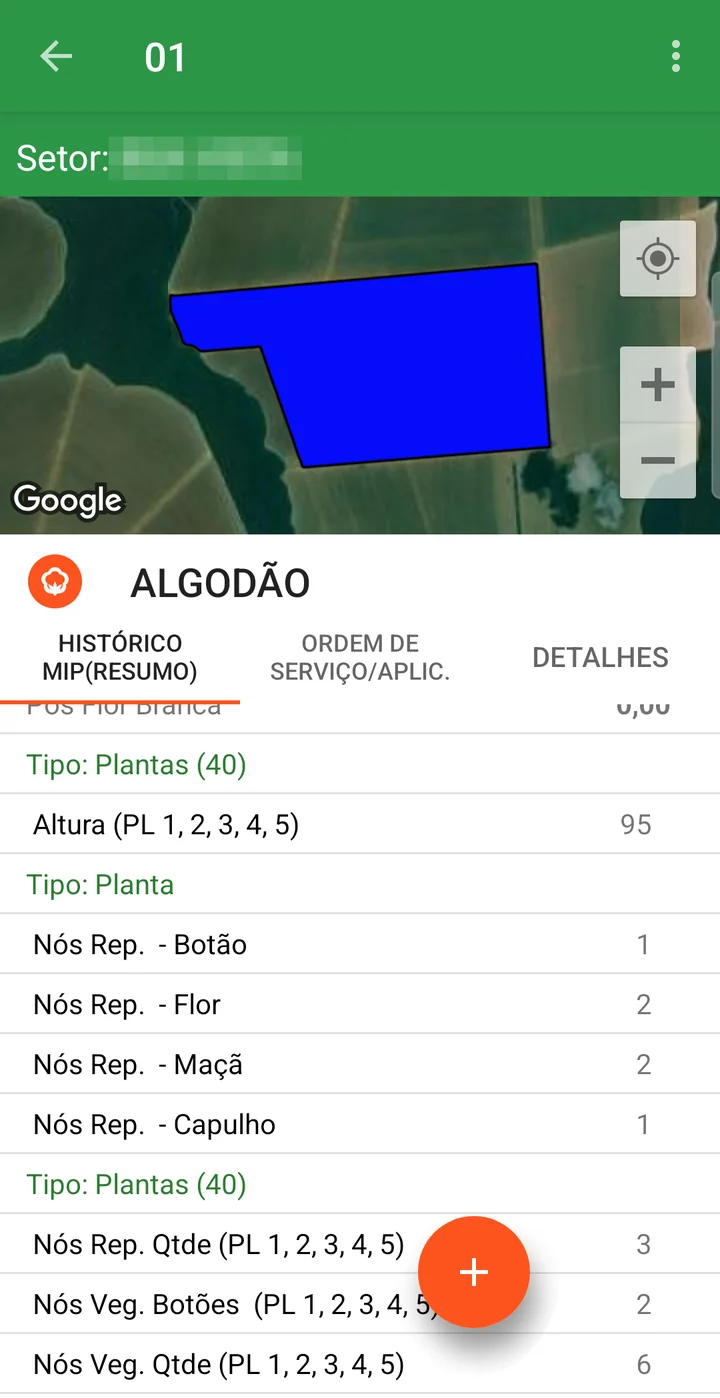
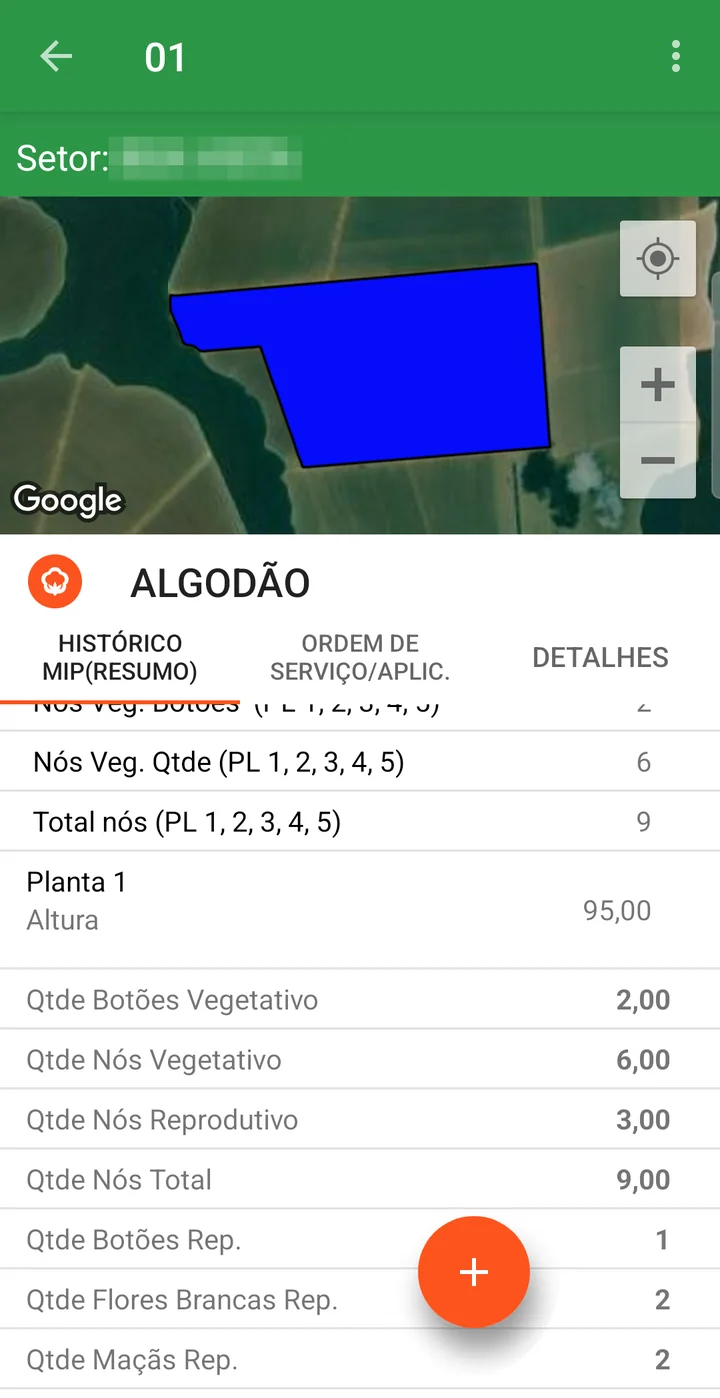
Once the plant is saved, the records show up in the point, under Found at Point, and in the field history. The history shows the day's summary — how many fruiting nodes have a square, flower, boll and open boll, the height and the nodes — and the detail for each plant, with Fruiting Squares Qty, Fruiting White Flowers Qty, Fruiting Bolls Qty, Fruiting Open Bolls Qty and Fruiting Abortions Qty
What's done with this measurement afterwards — the dashboard that draws the plant tree node by node and the node-by-node phenology reports — is in Node-by-node phenology mapping.
Counting methods
The method is how the pest was counted at that point — and it's what gives the number its meaning. Counting five caterpillars in one meter of row isn't the same information as finding five caterpillars in a hundred plants examined. There are three:
| Method | How it's done | When it's used |
|---|---|---|
| Beat cloth | The cloth is spread on the ground between two rows, the plants are shaken over it and whatever falls is counted. | The classic IPM method in soybeans: stink bugs, caterpillars and whatever drops off the plant. |
| Plant | A number of plants is chosen at the point — 10, 20 — and examined one by one, entering how many were checked. | When what matters is the share of the crop affected: leaf diseases, terminal damage, boll damage. |
| Meter | Everything in one linear meter of row is counted. | Weeds and soil pests, and much of cotton monitoring. |
What the system does with it
All the stops made in that field on that day form one scouting record — even when two scouts monitored the same field on the same date: both of their points go into the same calculation. The total number of points walked becomes the divisor of the averages, which is why stopping more often gives a truer picture of the area: with three stops, a hot spot in one corner can go unnoticed or become the whole average.
From there the system calculates one number per pest and compares it with the action threshold registered for that crop and stage. The result appears on the scouting panel of the home screen, in the pest × field matrix, with the number highlighted in the color of the range it fell into — that's what makes anything over the limit jump out, without reading row by row.
A badly entered stop doesn't just spoil itself: it goes into the average of the whole field for that day. That's why the web portal has the Scouting screen — so the agronomist can check and correct what came in from the field.
From here on: getting the system ready
Up to here was the field routine. The rest of this guide is the setup order — the sequence of records that makes this routine work, each one with its article linked along the way:
- Steps 1 to 4 — setup. They define what will be monitored, how it's counted and at what number the farm takes action. It's a one-time job: done at implementation and reviewed every season, when the crop or the strategy changes.
- Step 5 — the routine. What needs to be enabled for the scout to monitor day to day.
- Steps 6 and 7 — reading the results. Where the agronomist checks what came in and sees the big picture.
Much of this comes ready-made. upCampo maintains a pest library with scientific name, class and counting method already set up, and importing from it takes care of most of step 2. What each farm actually customizes is shorter than it looks:
- which pests to monitor — the list for your crop, not the whole catalog;
- how each one is counted — the method and the calculation method, which decide what the number means;
- at what number to act — the action thresholds, by crop and by stage. It's the one part nobody can fill in for you: it's the farm's agronomic decision;
- what gets added together — pest groups, when the decision is made for the group rather than the species.
🧱 1. Pest Class
Location in the system: Basic > Pest Class
Main function: group what will be monitored into families — Caterpillars, Stink bugs, Leaf diseases, Broadleaf weeds. The class is what organizes the list in the app and in reports.
Important: the class also separates pest, disease, weed and evaluation. Think of it as the drawer: if the scout is going to look for "caterpillar" in the app, that's what the drawer needs to be called.
✅ With the classes created, register the pests.
🐛 2. Pests, weeds and diseases
Location in the system: Basic > Pest
Main function: the module's central record. This is where you define what is counted, how it's counted and at what number the farm takes action.
What to decide for each pest:
- Calculation method — how the count from the points becomes the field number: Simple sum, Average per point, Average per occurrence or Preset value. It's the choice that changes the result the most; the difference is explained in step 6.
- Sizes — when the decision depends on the insect's stage (small, medium, large caterpillar), the Size tab lets you count each range separately.
- Preset levels — for what isn't counted as a number: the scout picks Low, Medium or High and the system calculates the percentage of points in each option.
- Crop — the pest only appears in the app for the crops checked on the Crop tab. There's an Include all crops button for those who monitor the same list everywhere.
✅ With the pest registered and linked to the crop, define the action threshold.
📈 3. Action threshold
Location in the system: Control Levels tab, inside Basic > Pest
Main function: tell the system at what number that pest becomes a problem. The action threshold is what classifies the result into a range — with a name and a color — and highlights on the panel whatever is over the limit. Without it, the scouting result is just a loose number: the system records the count but has no way of saying whether it's high or low.
Important: the threshold is registered by crop and by stage range, because the same count means different things at different points in the crop. Two caterpillars per meter at V4 aren't the same problem as at R5.
Each range is an interval with a name and a color. The system compares the field result with the range using the stage entered at the point opening, and the range runs from the starting value (inclusive) to the ending value (exclusive) — that's what the From (=<) and To (>) headers mean.
✅ Threshold set, decide whether you'll use pest groups.
🧮 4. Pest group (optional)
Location in the system: Basic > Pest Group
Main function: add up the count of several pests into a single total and give that total an action threshold, by crop and stage range.
When to use it: when the decision is made for the group, not the species. The classic case is the caterpillar complex: three different species, each below the threshold, that together justify spraying. If your farm decides pest by pest, skip this step.
✅ Setup done. Now to the field.
📱 5. Field data collection
Where it happens: in the upCampo field app, on the scout's phone — how a stop works is described at the beginning of this guide.
What needs to be ready for the scout to monitor:
- the field enabled in the app, which depends on the Season Planting;
- the pest linked to the crop of that planting, on the Crop tab of the pest record — if it isn't, it won't be offered at counting time;
- the scout with their own user, because their login is what stamps who scouted each point;
- the crop stages registered, since the stage entered at the point opening is what picks the action threshold range.
The routine belongs to the farm, not the system: how often each field is visited and how many stops are made per field are agronomic decisions. upCampo doesn't enforce a frequency or a minimum number of points: it records what was done, with date, scout and coordinate, and that's what lets you check later whether the area was really walked.
✅ With the points synced, the result is already in the web portal.
🔬 6. Scouting: from the point to the field number
Location in the system: Crops > Scouting
Main function: look up what came in from the field and, when needed, enter or correct a scouting record through the web portal.
What the scout records is the count at each point. The number the agronomist looks at is the result for the field on that day, calculated over all the points according to the Calculation method chosen in the pest record:
| Calculation method | Math | Answers |
|---|---|---|
| Simple sum | total counted, not divided | how much showed up in the field |
| Average per point | total ÷ points walked | what the average pressure on the area is |
| Average per occurrence | total ÷ points where the pest appeared | where it's present, how much there is |
| Preset value | points that chose the option ÷ total points × 100 | in what percentage of the area the level is High |
The difference between the two averages causes the most confusion. A concentrated hot spot — heavy pest in one corner and nothing elsewhere — gives a low average per point and a high average per occurrence. Choosing the wrong method is the most common reason the result comes out below the action threshold when the scout swears the pest is there.
✅ Result calculated — see it on the panels.
📊 7. The scouting panel
On the web portal's home screen, the Scouting tab gives the farm overview in three views: Default, Pest x Field — the matrix where each result appears in the color of the range it fell into — and List. There's also the period filter, field selection and the option to show only the pests found. It's the screen for whoever arrives in the morning and wants to know where to go today.
In the reports, the history by field and by pest lets you follow the trend over the season — it's what shows whether the spray worked.
🪤 Traps: the other way to count
Not every pest is counted with a beat cloth. Moths and other flying insects are monitored with a trap — the scout installs it in the field and checks it periodically to count what was caught.
- Trap Group — the type of trap, what it catches and the action thresholds for that catch. It's the equivalent of the pest record, for traps.
- Trap x Season — the installation: which trap is in which field this season, with coordinates. The Collections tab stores each count.
The logic is the same as scouting: setup first, field collection next, result compared with the threshold.
📷 Observation: the free-form record
Location in the system: Crops > Observation
Not everything you see in the field fits in a count: planting gaps, machine damage, erosion, a plant with a symptom nobody could identify. Observation is the free-form record, with photo and location, made in the same app.
It serves as the season's memory and as evidence: the photo stays tied to the field and the date.
- field counts reaching the web portal the same day, even with no signal in the field;
- each pest's result already compared with the action threshold and highlighted on the panel, instead of a spreadsheet read at the end of the week;
- the pest history by field throughout the season, to decide based on what has already happened;
- a record of who scouted, when and where — including the coordinate of each point.
Want to understand the whole module, including what it does on the scout's phone? See the up.Monitora page on the upCampo website.
❓ Frequently asked questions
Where do I start to use pest monitoring?
With the Pest Class and the Pest record — preferably using the Import standard pests button, which brings in the upCampo library ready to use. Then come the action thresholds by crop and stage. Before all that, the farm needs to have field, season and Season Planting registered, because the planting is what enables the field in the app.
How many points do I need in each field?
As many as you see fit. upCampo doesn't define a point grid, doesn't mark on the map where to stop and doesn't require a minimum number: the scout walks the field and stops wherever they think they should, and the system records each stop with date, time and coordinate. What's worth knowing is that the total number of points walked is the divisor of the averages — with few stops, a hot spot in one corner can go unnoticed or become the average of the whole field. How many stops to make and how often to return to each field is the farm's agronomic decision.
The scout monitored, but the result shows no highlight at all. Why?
The highlight comes from the action threshold. Check three things in the pest record: whether a threshold is registered for that crop, whether there is one for the stage range the crop is in, and whether the calculated result falls inside any range. A pest without an action threshold shows the number normally, just without the classification that would say whether it's high or low.
What's the difference between "Average per point" and "Average per occurrence"?
Average per point divides the total counted by the points walked and answers what the average pressure in the field is. Average per occurrence divides only by the points where the pest appeared and answers, where it is, how much there is. In a concentrated hot spot the first gives a low number and the second a high one — both are right, they answer different questions. The choice is in the Calculation method field of the pest record.
The field doesn't show up in the scout's app. What's missing?
Almost always the Season Planting. Registering the field isn't enough: the planting is what ties field, season, crop and variety together, and it's what enables the field in the app. If the field shows up but the pest doesn't, check the Crop tab of the pest record — the pest is only offered for the crops checked there.
Do I need internet in the field to monitor?
No. The upCampo field app works offline: it stores the points on the device and syncs when the connection comes back. Several scouts can monitor the same farm at the same time, and everyone's points go into the same scouting record for the day.
When should I use a pest group instead of registering pest by pest?
When the spray decision is made for the group. The classic case is the caterpillar complex: three species, each below the threshold, that together justify spraying. The Pest Group adds up the count of the chosen pests and gets its own action threshold, by crop and stage range. If the farm decides species by species, it isn't needed.
What's the difference between scouting, traps and observations?
Scouting is counting at points inside the field — the beat cloth, counting per plant or per meter. A trap is passive capture, for flying insects, counted at each visit. An observation is the free-form record, with photo, of what doesn't fit in a count — planting gaps, machine damage, a symptom to identify.
Can I enter scouting through the web portal, without the app?
Yes. The Scouting screen lets you enter and correct records through the web portal — it's the way to fix a wrong entry or record a count made on paper. The normal path, though, is the app: it already brings the crop's pest list and stores the coordinate of each point.